Guide // Sound
Sound wave art: waveforms, spectrograms and prints
Sound wave art turns something you hear into something you can see. A sound is a pressure wave, and there are two classic ways to draw it: as a waveform, which shows loudness over time, and as a spectrogram, which shows which frequencies are playing at each moment. Here is how both work, and how our sound wave posters are made with code.
01What a sound wave is
Sound is air being pushed and pulled. A speaker cone or a guitar string moves back and forth, the air next to it is squeezed and stretched, and that pattern of pressure travels outward at about 343 metres per second.
A microphone turns the pressure at one point into a number that changes over time. Plot that number and you have a waveform. Its height is the amplitude, which we hear as loudness, and how many times it repeats per second is the frequency, measured in hertz, which we hear as pitch. People hear roughly from 20 Hz to 20,000 Hz; the A above middle C is 440 Hz.
y(t) = A·sin(2π·f·t + φ)02Harmonics: why a violin and a flute sound different
A pure sine wave sounds thin, like a tuning fork. Real instruments play many sine waves at once: a fundamental frequency plus partials above it. On a string or a voice the partials sit near whole multiples of the fundamental and are called harmonics.
How strong each partial is gives a sound its colour, or timbre. A violin and a flute playing the same 440 Hz note share the fundamental but mix their partials differently, so their waveforms have different shapes even though the pitch is the same.
y(t) = Σₖ aₖ·sin(2π·k·f·t + φₖ)03The envelope: how a sound starts and fades
A sound also changes over time. A piano note hits hard and fades; a bowed cello note swells and holds. The curve that shapes the loudness over time is the envelope. In a waveform plot it is the outline you see around the fast wiggles inside.
Musicians and synthesiser makers describe it in four parts: attack, decay, sustain and release. A drum is almost all attack; a pad sound is almost all sustain. The envelope is often what makes a waveform picture recognisable at a glance.
04Waveform art: loudness over time
The simplest sound wave art is a waveform drawn large: time runs left to right, amplitude goes up and down. A spoken phrase or a few seconds of a song becomes a row of peaks and valleys, loud passages tall and quiet ones flat.
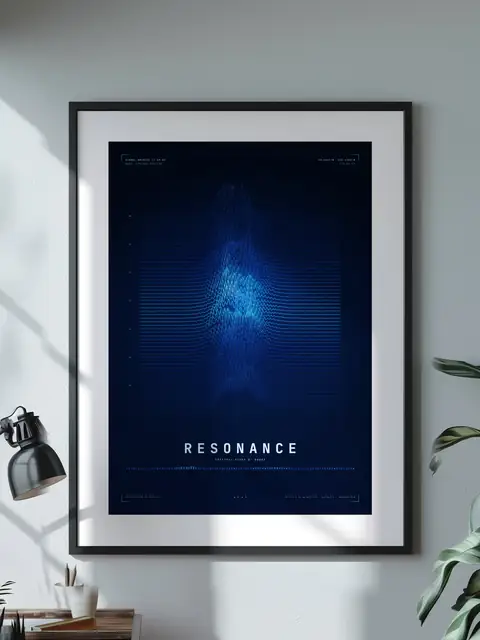
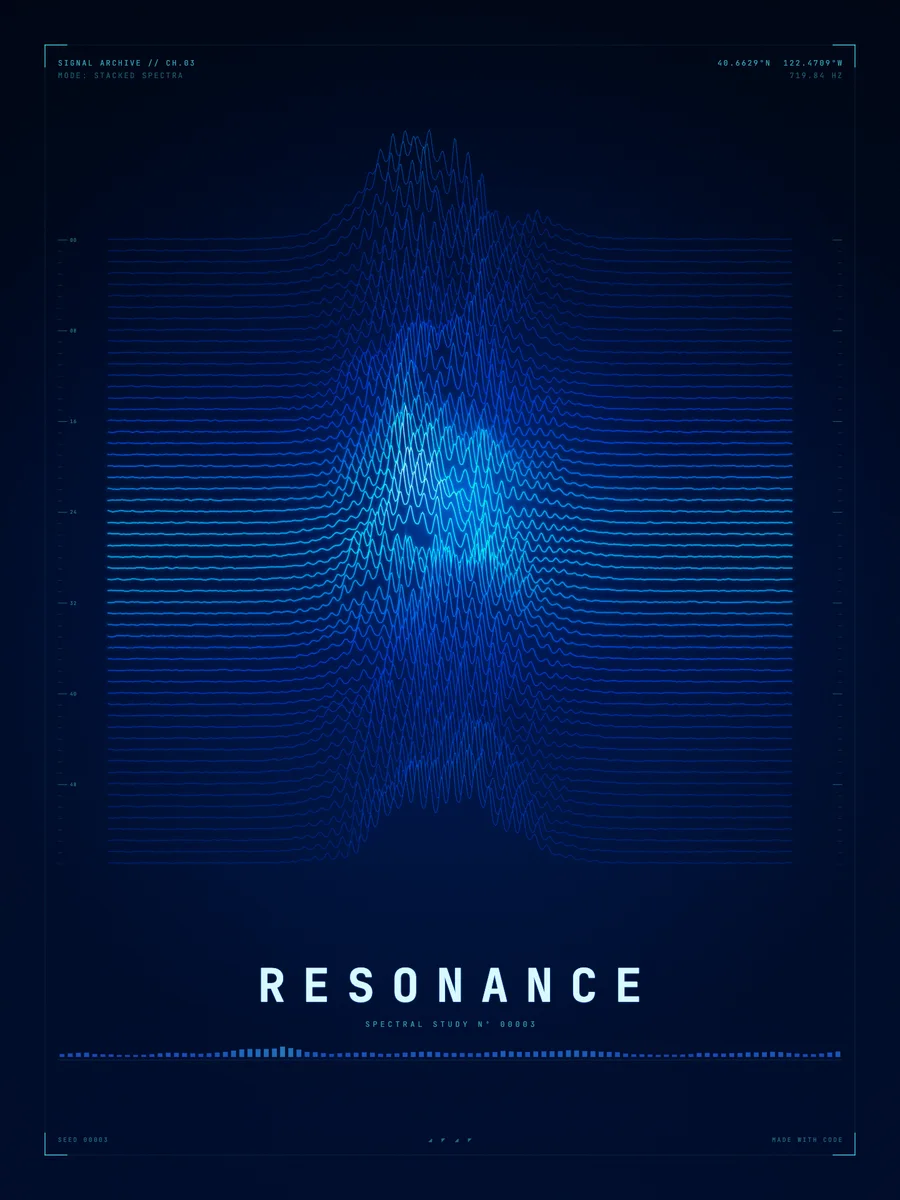
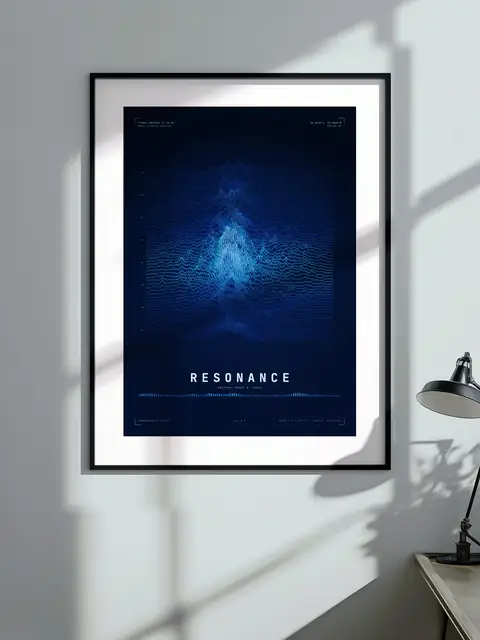
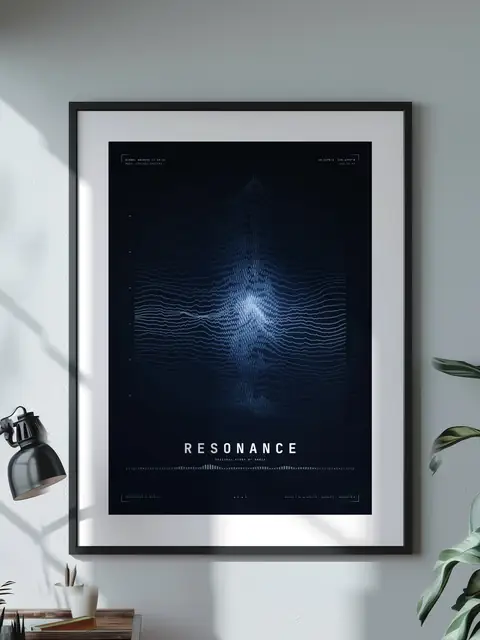
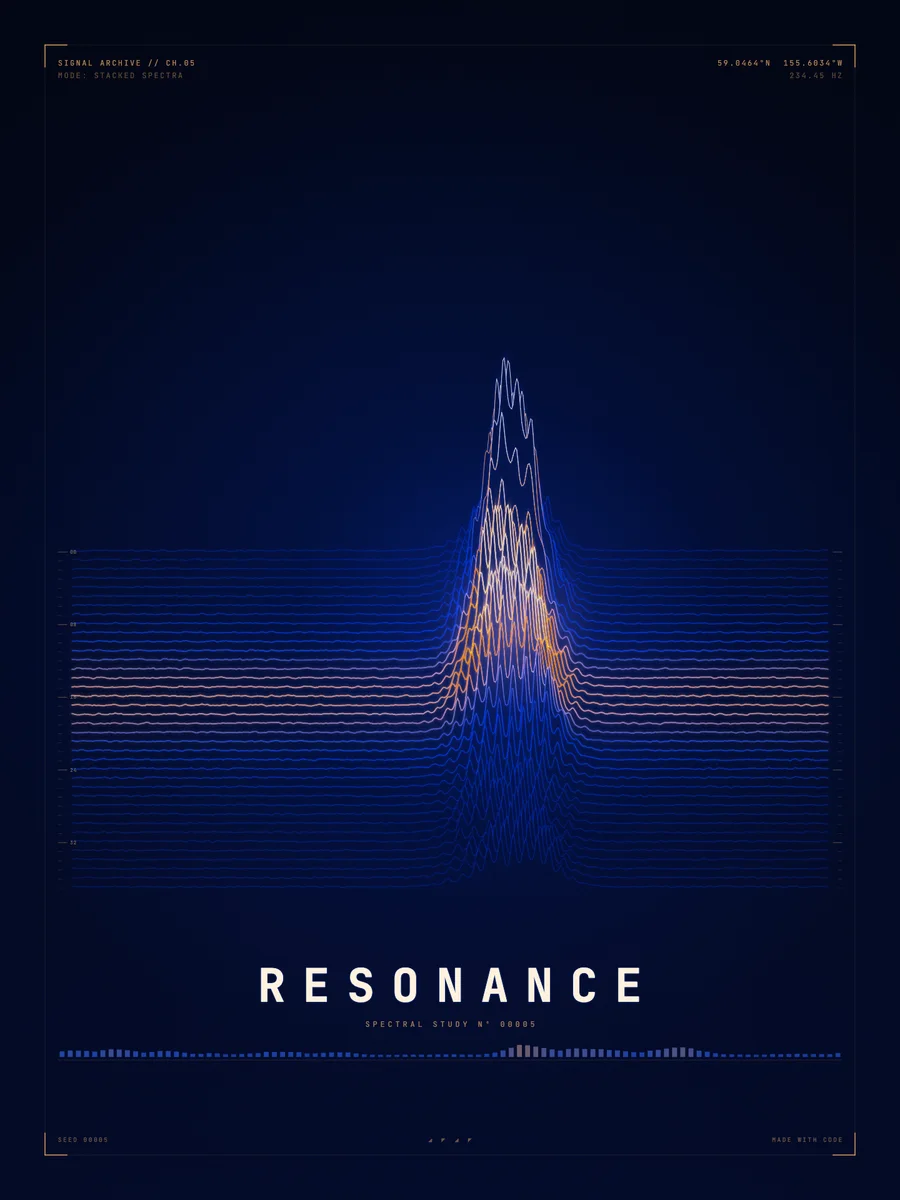
Stack many waveforms and the picture becomes a landscape. Our Silent Storm poster stacks 62 lines. Each one carries a fast carrier wave of 47.6 cycles shaped by smooth envelopes and a little noise, and the lines in front hide the ones behind, so the sound reads as a mountain range.
yᵢ(t) = bᵢ − A·env(t)·eᵢ·(1.56·n₁(t)² + 0.45·|sin(2π·f·t + φᵢ)|³·n₂(t))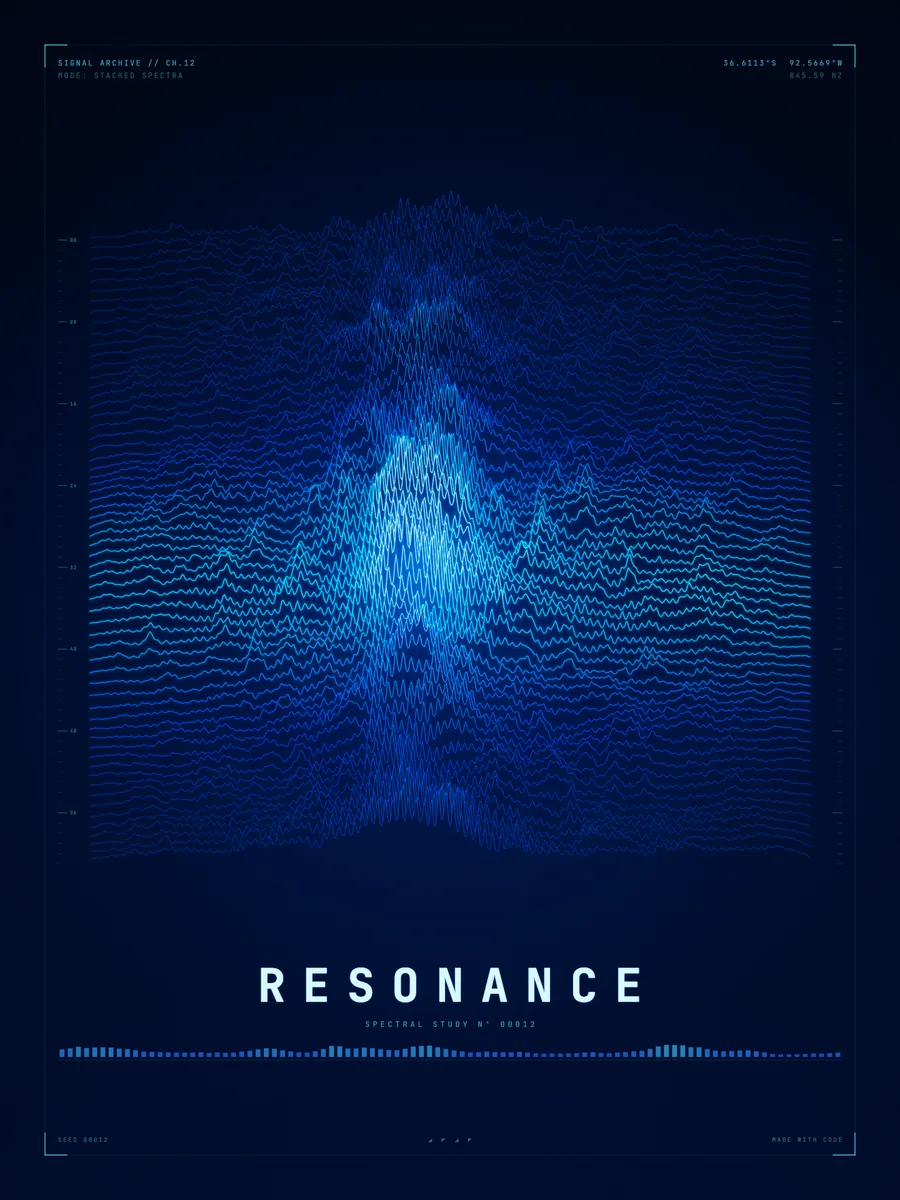
05Circular waveforms
Wrap the time axis around a circle and a waveform becomes a ring: the angle is time and the radius moves in and out with the amplitude. A loop of sound closes back on itself, which suits a sound that repeats.
Our circular waveform posters nest dozens of these rings. Orbit Zero has 40 rings, 36,000 samples in all, with each ring pushed outward where its envelope is loud.
rᵢ(θ) = Rᵢ + A·env(θ)·eᵢ·(1.56·n₁(θ)² + 0.45·|sin(f·θ + φᵢ)|³·n₂(θ))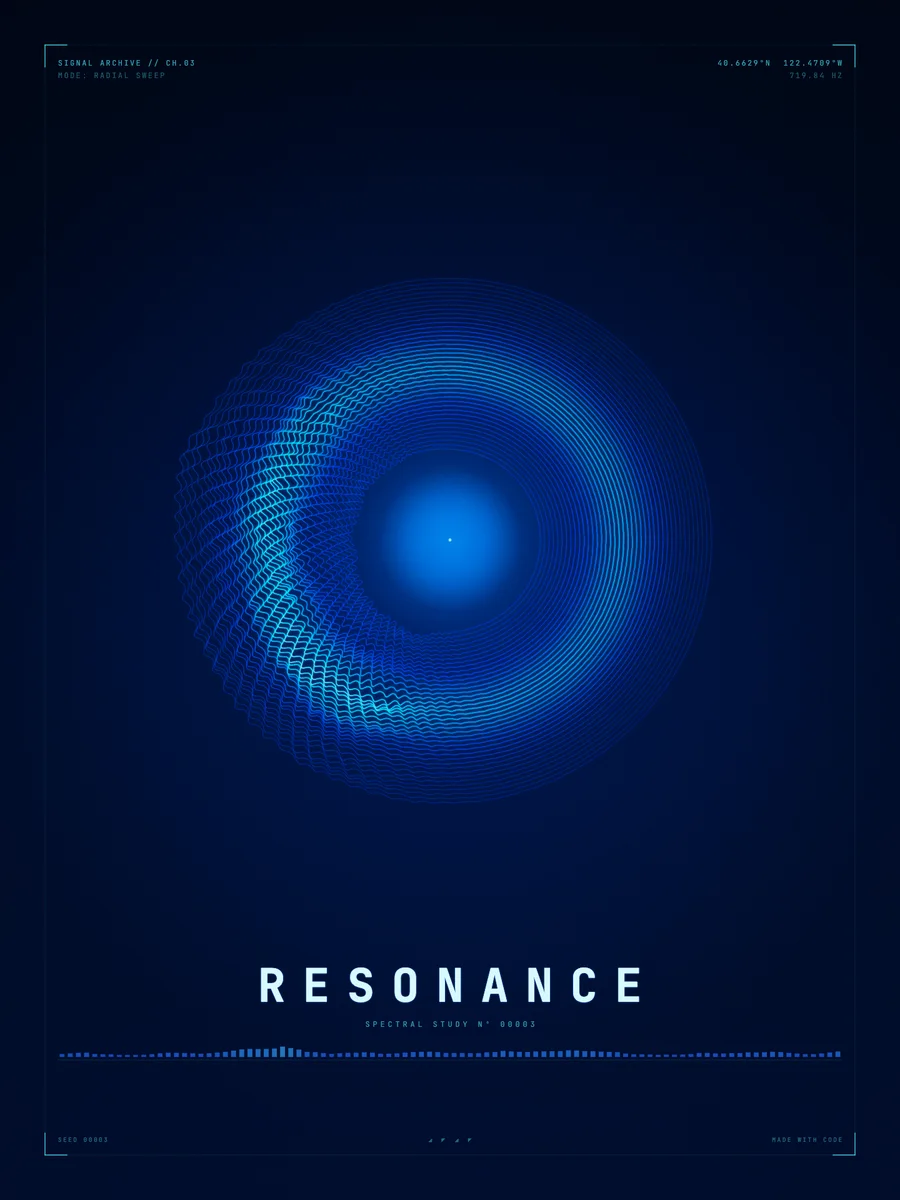
06Spectrograms: which frequencies, when
A waveform shows how loud a sound is, but not which notes are in it. For that you split the sound into its frequencies. In 1822 Joseph Fourier showed that any repeating signal can be written as a sum of sine waves, and the Fourier transform finds how much of each frequency a signal contains.
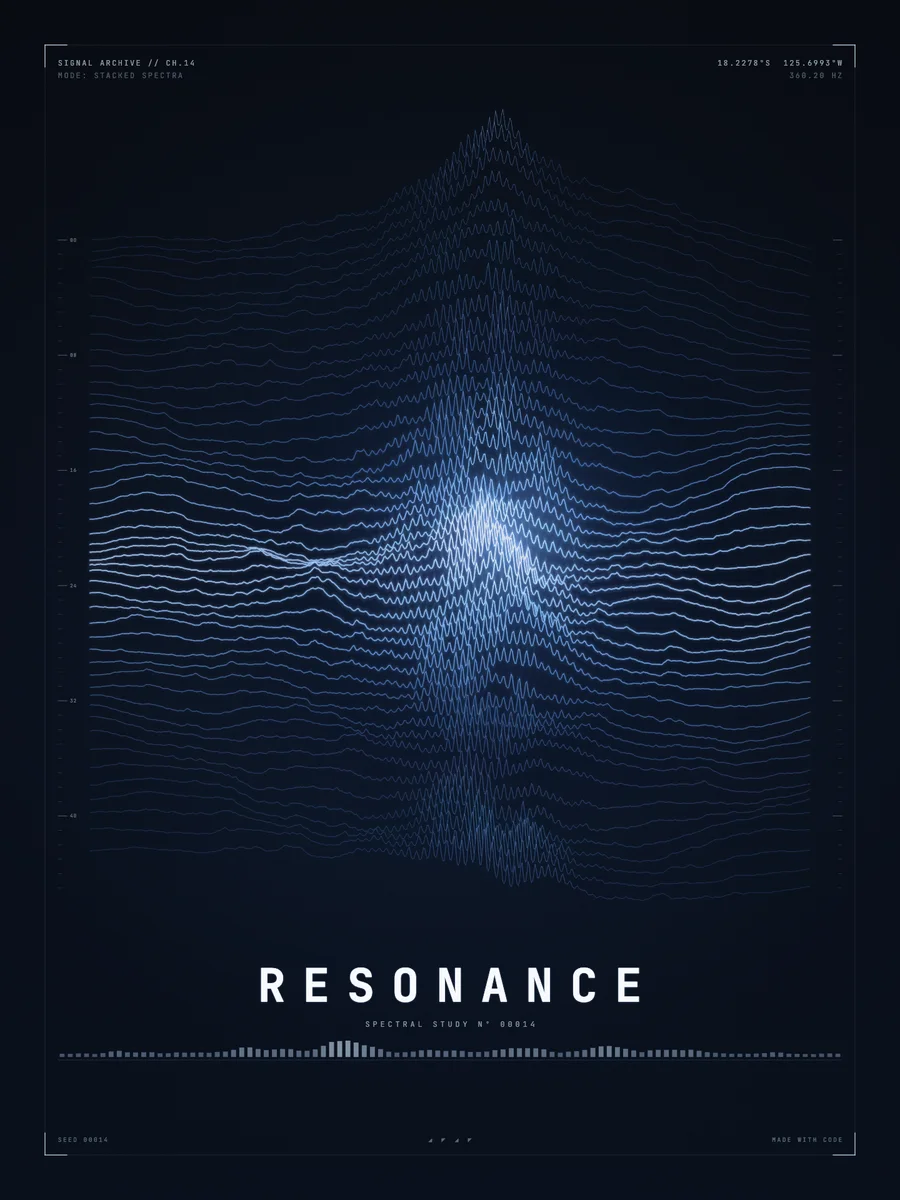
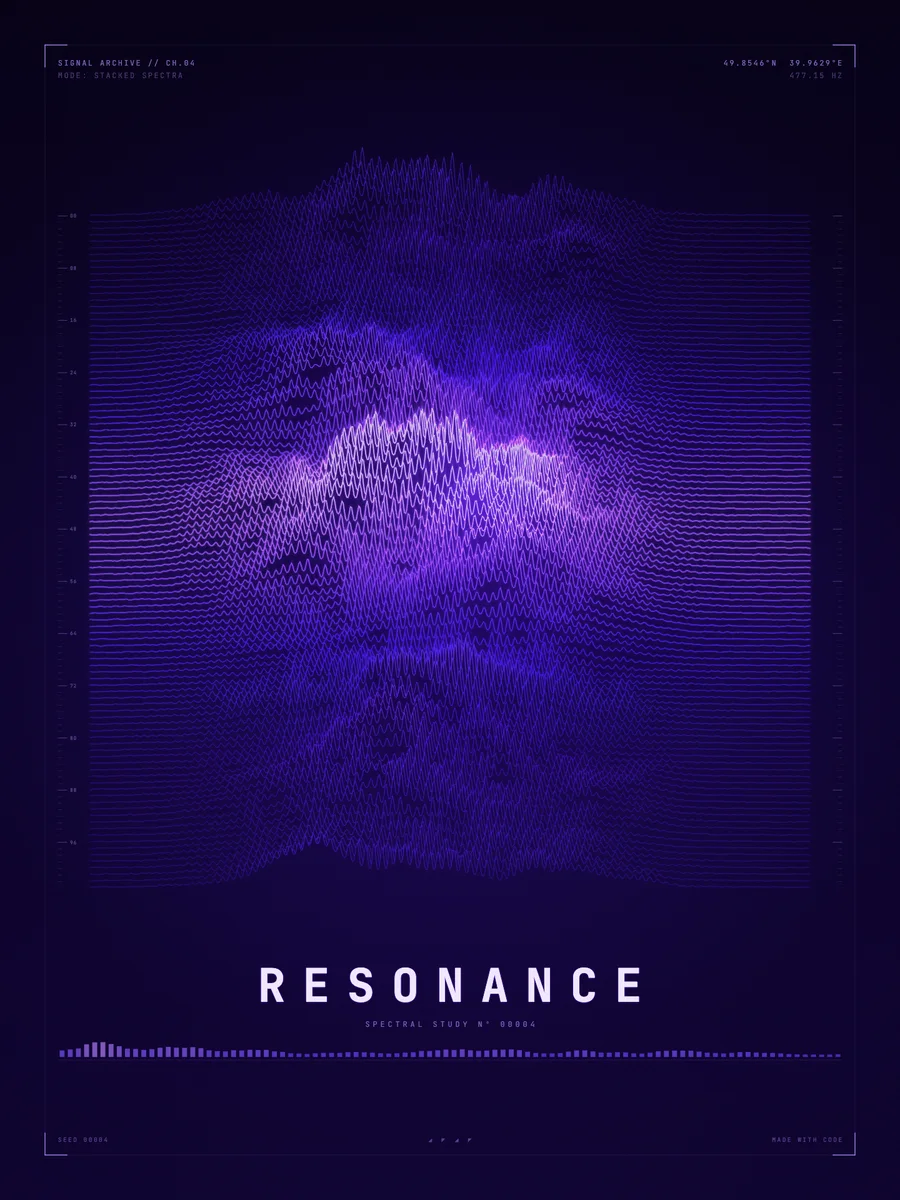
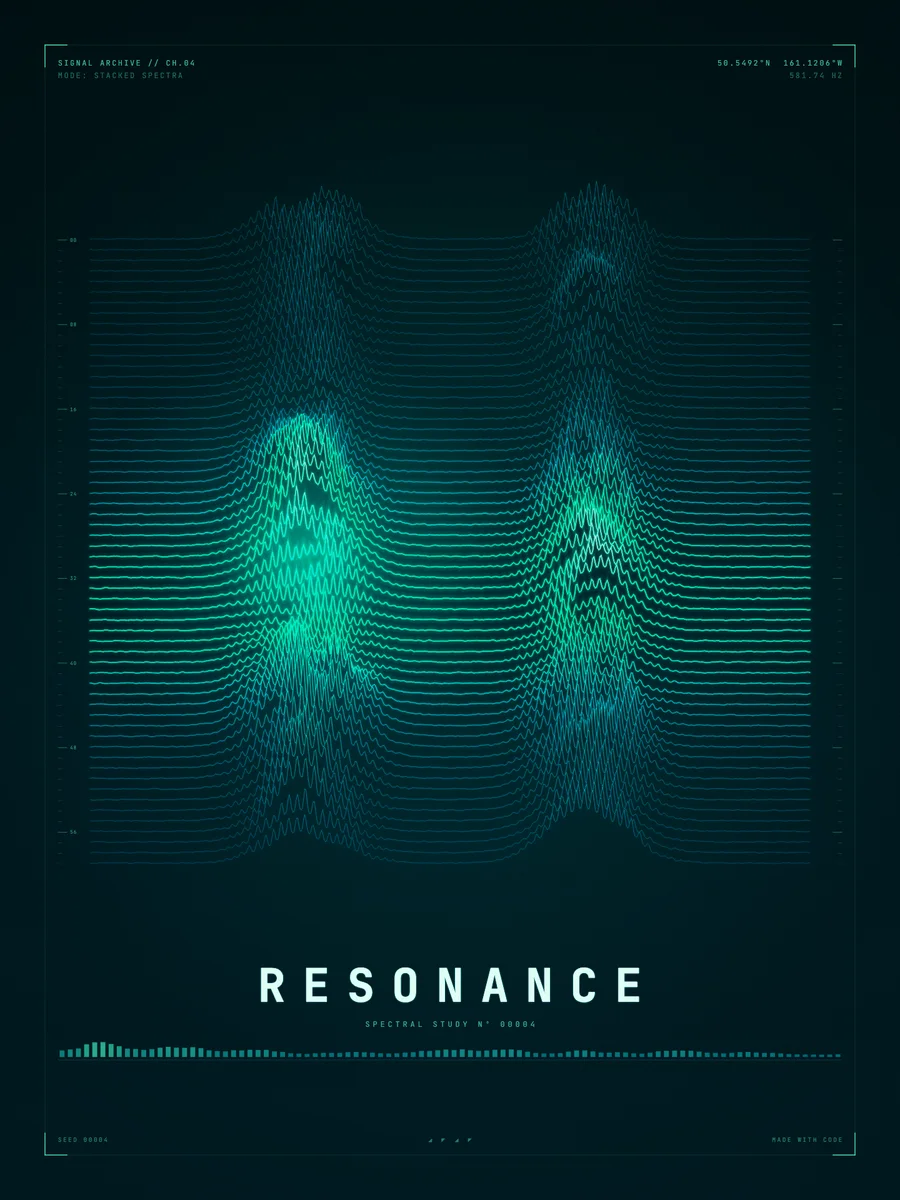
A spectrogram applies the transform to one short slice of sound after another and lays the results side by side: time along one axis, frequency along the other, strength as brightness or height. Bell Labs built the first sound spectrograph in the 1940s, and the fast Fourier transform of Cooley and Tukey, published in 1965, made spectrograms quick enough for any computer.
X(f) = ∫ x(t)·e^(−2πi·f·t) dt07Spectrogram cities
Draw a spectrogram in 3D, with strength as height, and every cell of the grid becomes a tower. Low and high frequencies form the streets; loud moments rise into skyscrapers. That is the idea behind our Spectrogram City series.
Metropolis is a 26 × 26 grid, 676 towers. The height of each tower comes from a signal built from four partials and three swells, multiplied across frequency band and time slice, with a little noise so no two neighbouring towers are quite the same height.
H(i, j) = (0.75·s(i/G)·s(j/G) + 0.25·n(i, j))^2.1 · c(i, j)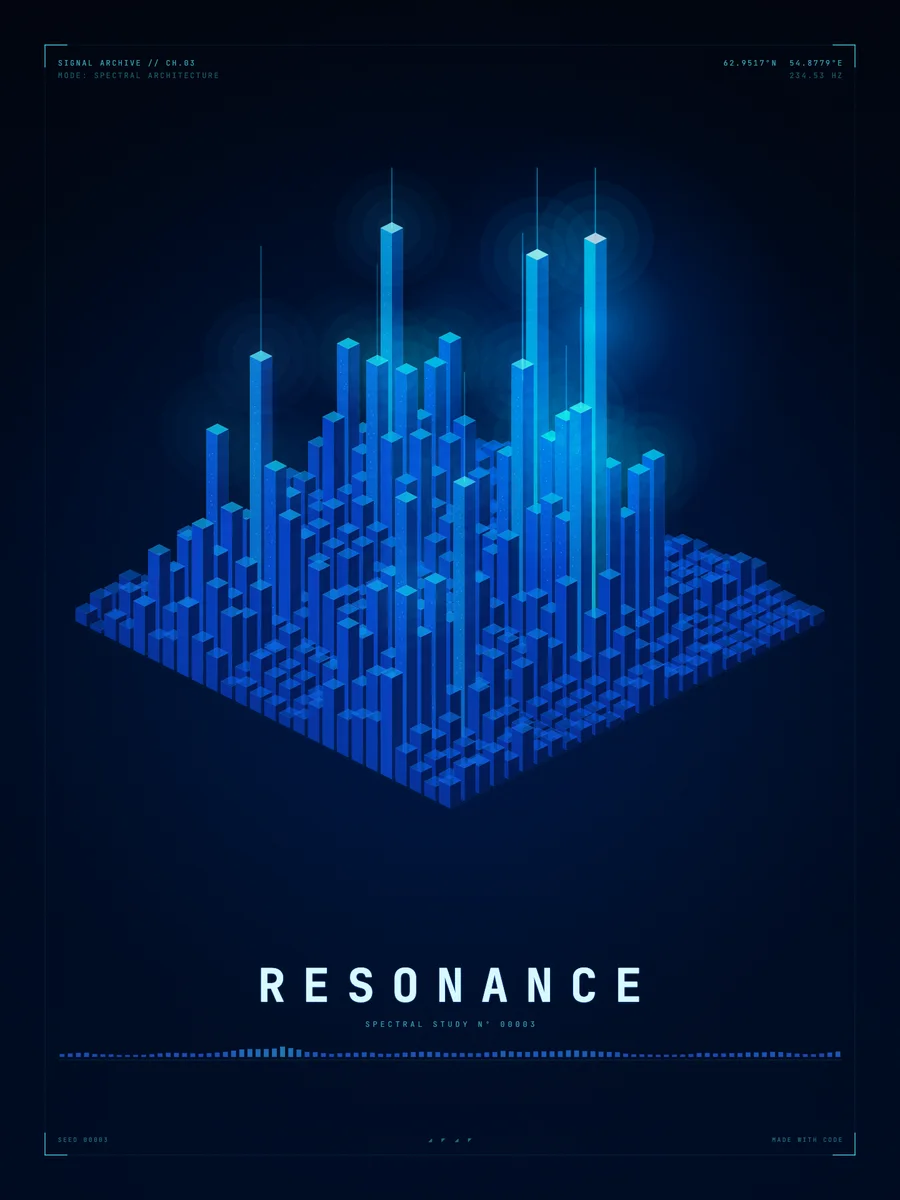
08Recorded sound or written sound?
Some sound wave art starts from a recording: a voice message, a first dance song, a heartbeat. The shape is then fixed by the audio. Our posters work the other way round. The sound is written as equations, a sum of partials shaped by envelopes, and the program draws it directly, so every line can be tuned for the picture.
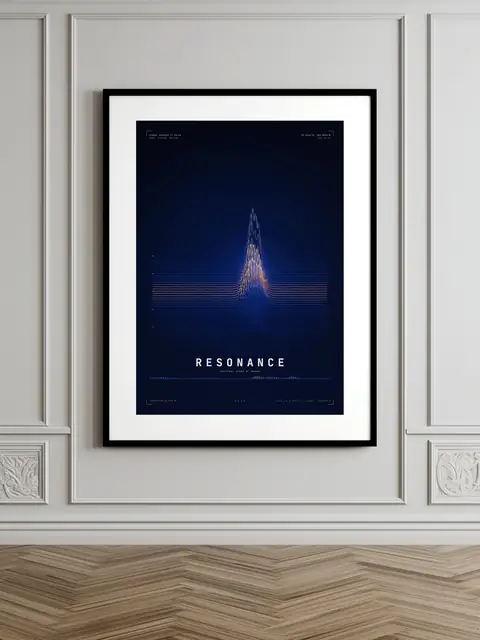
Each product page lists the exact equations, parameters and measurements behind that piece. What you see on the page is exactly the print you get, on fine art matte paper at 300 DPI, framed or unframed.
FAQQuestions
What is sound wave art?
Art that turns sound into a picture, usually as a waveform (loudness over time) or a spectrogram (which frequencies play at each moment). It can start from a recording or from a sound written as equations.
What is the difference between a waveform and a spectrogram?
A waveform shows the amplitude of a sound over time, so you see how loud it is. A spectrogram shows the strength of each frequency over time, so you see which notes and tones are in it.
How is a spectrogram made?
The sound is cut into short slices, each slice is split into its frequencies with a Fourier transform, and the results are placed side by side, with strength shown as brightness or height.
Is sound wave art a good gift for a musician?
It suits musicians, sound engineers and anyone who works with audio, because the picture uses the same waveforms and spectrograms they see in their software every day.