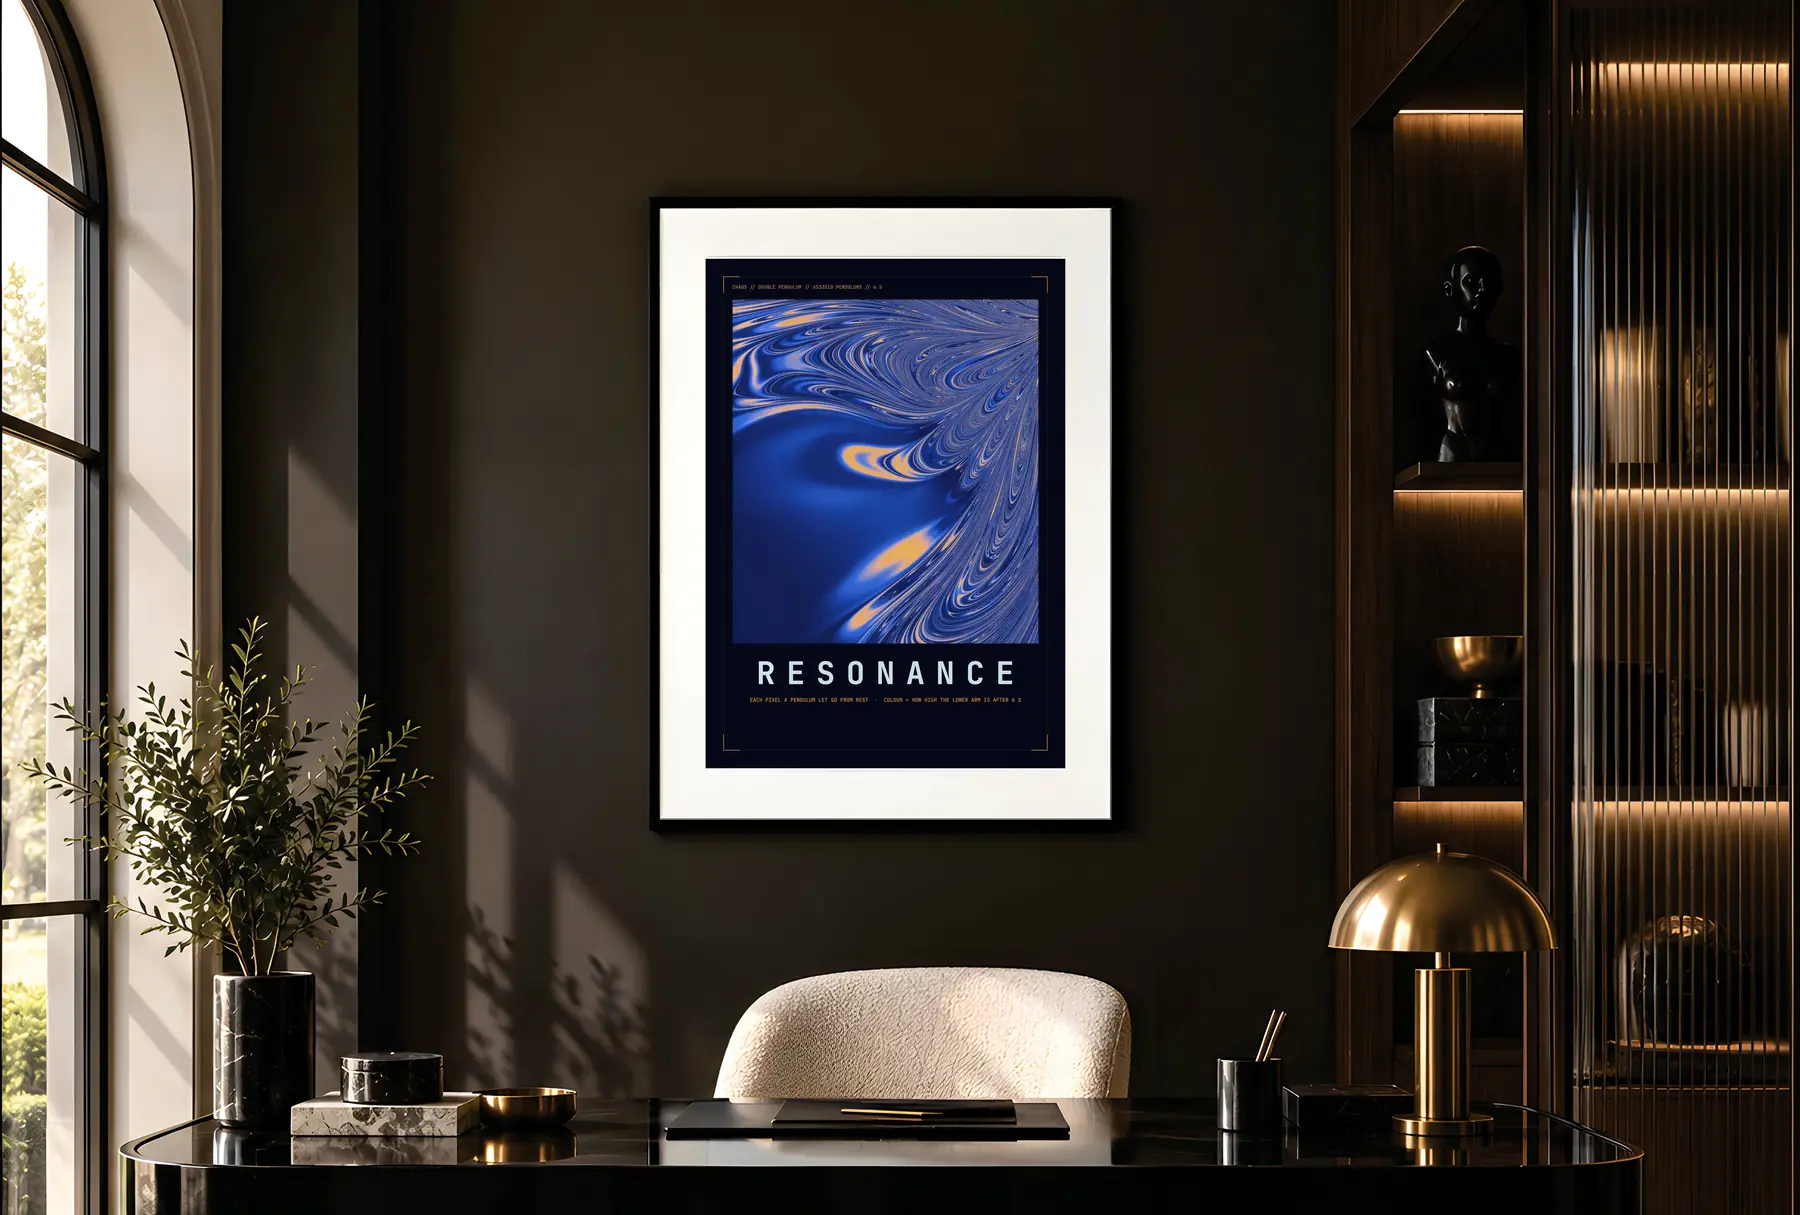
SERIES J // Liquid
Double pendulum posters
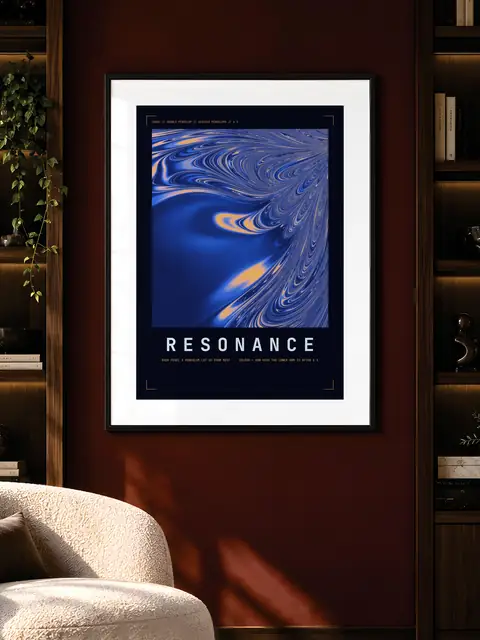
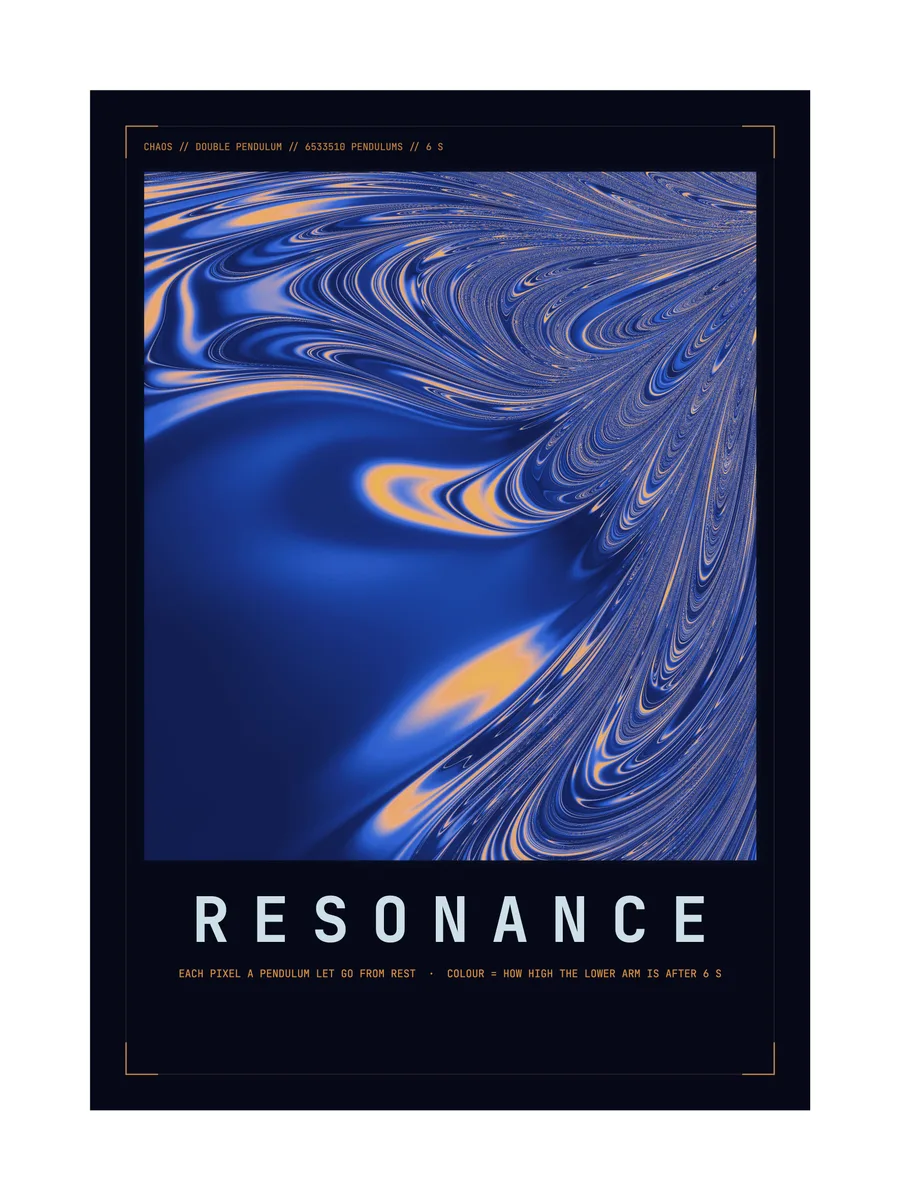
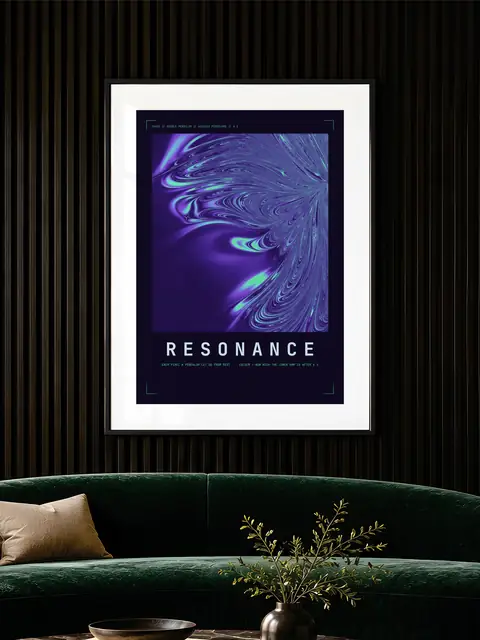
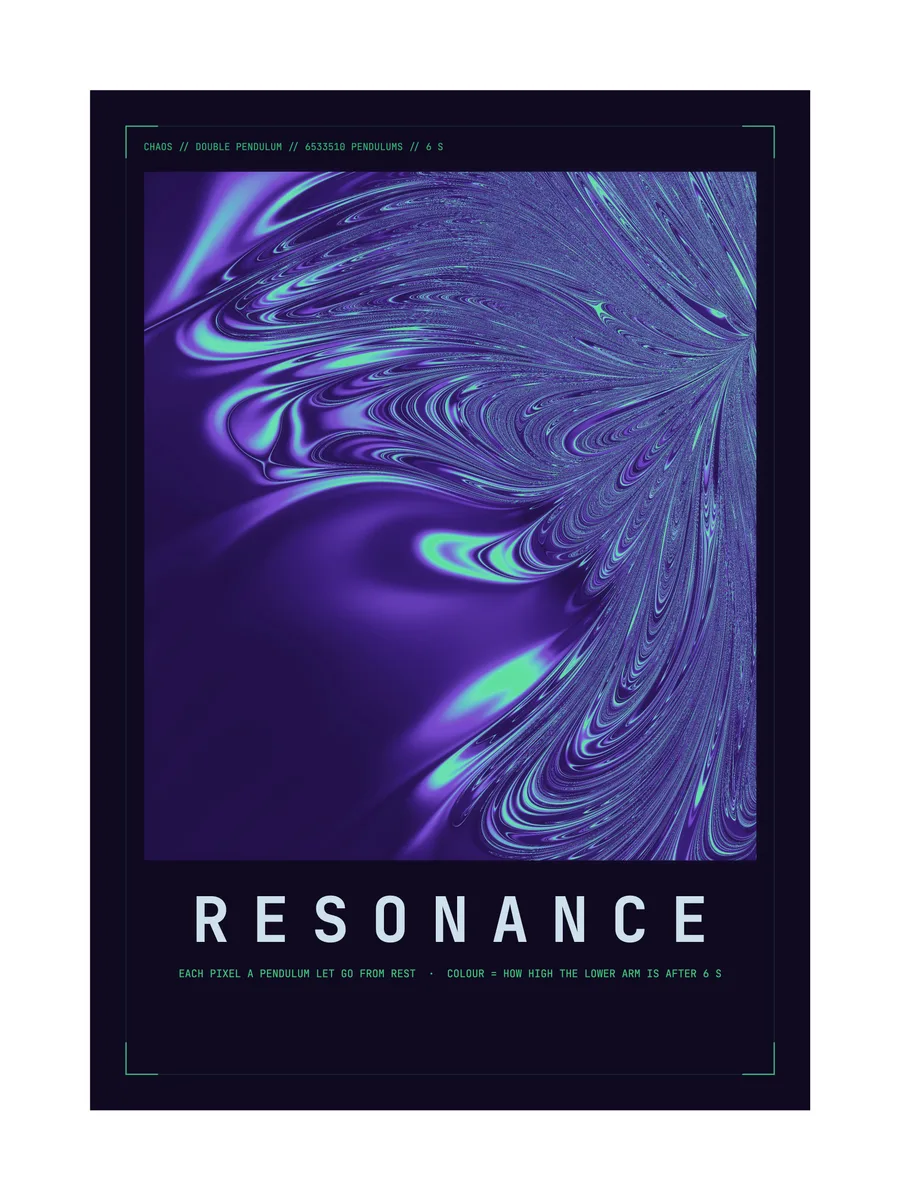
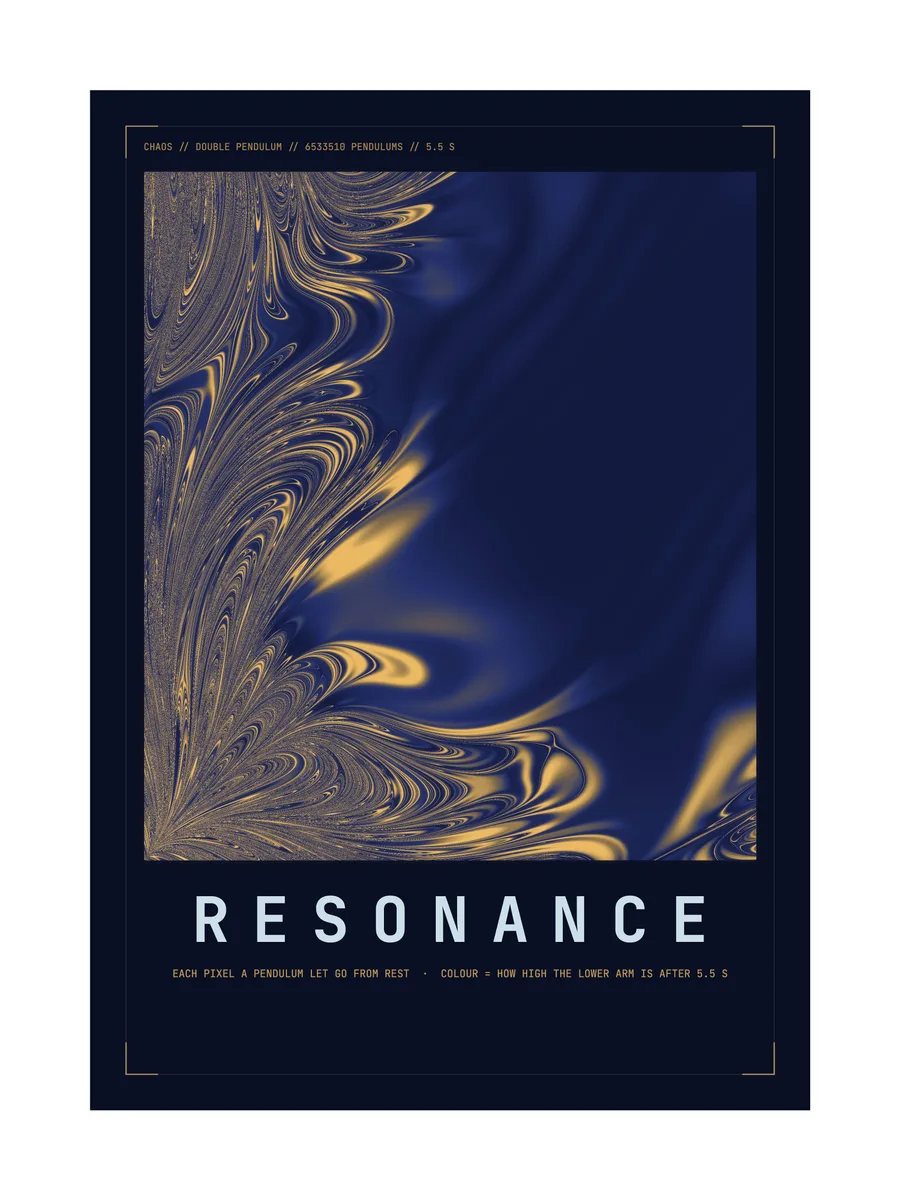
Millions of double pendulums, one per pixel, each let go from rest at a slightly different angle. Colour is how high the lower arm is a few seconds later. Where neighbours agree the paint runs smooth; where chaos starts it folds into fine streaks.
Read the guide: Double pendulum chaos: equations and sensitivity →Filters Liquid
MATHEMATICS
The maths behind the picture
- 01
One pendulum per pixel
A double pendulum is one arm hanging from the end of another. Every pixel is its own pendulum: across the image the starting angle of the upper arm changes, down the image the lower arm. All of them start at rest.
pixel (x, y) → θ₁(0), θ₂(0) - 02
Equations of motion
Each pendulum follows the laws of motion for two equal arms and equal masses, written with Lagrange's method and solved step by step with the Runge-Kutta method (RK4) for a few seconds.
L = T − V, d/dt ∂L/∂θ̇ = ∂L/∂θ - 03
Colour is the height
After a few seconds the program measures how high the end of the lower arm is and turns that into colour. Smooth areas are pendulums that swing together; the fine streaks are where a tiny change in the start gives a completely different swing. That is chaos.
h = −(cos θ₁ + cos θ₂) at t = T
HISTORY
Where this idea comes from
- 1788
Joseph-Louis Lagrange publishes his Analytical Mechanics, the method still used to write down how a double pendulum moves.
- 1963
Edward Lorenz finds that a tiny change in the starting numbers of a weather model gives a completely different forecast.
- today
Here every pixel is one pendulum, millions of them, simulated side by side.