Guide // Art and code
Algorithmic art: history, methods and examples
Algorithmic art is art made by writing down a procedure, a finite list of exact steps, and letting it produce the image. This page covers where the idea comes from, the early artists who used it, what an algorithm adds to a drawing, and three of our own pieces taken apart rule by rule.
01What an algorithm is
An algorithm is a finite sequence of unambiguous steps that turns an input into an output. The word comes from the name of the ninth-century mathematician al-Khwarizmi. A recipe is close to one, except that a recipe leaves room for judgement and an algorithm does not.
In art, the input is a set of numbers and rules, and the output is a picture. The artist decides the rules, the starting values and when to stop, and then the procedure does the drawing. That division of work is what separates this kind of art from sketching by hand.
02The early artists
Vera Molnar, born in Budapest, began in the 1950s and 1960s by working out systematic variations of simple shapes on paper, a method she called the imaginary machine, before she had access to a computer. She went on to use computers from the late 1960s.
In Germany, the mathematician Frieder Nake and the engineer Georg Nees both showed plotter drawings in Stuttgart in 1965, among the first public exhibitions of computer art. Manfred Mohr, who trained as a jazz musician before turning to art, moved to programs in the late 1960s and spent decades on cubes and their rotations in higher dimensions.
What these artists share is that the program is part of the work. Changing one rule or one number gives a related but different image, so the artist is exploring a family of pictures rather than making one.
03Plotters and screens
Early computers had no screens worth drawing on. The output device was a plotter: a pen held over paper that moved to coordinates sent by the program, drew a line to the next coordinates, and lifted. Every picture was a list of line segments.
Today the output is usually pixels, but the idea is unchanged. The program computes positions and colours, and a device draws them. Our posters are rendered by programs written in JavaScript and sent to print as finished images.
04Rules that call themselves
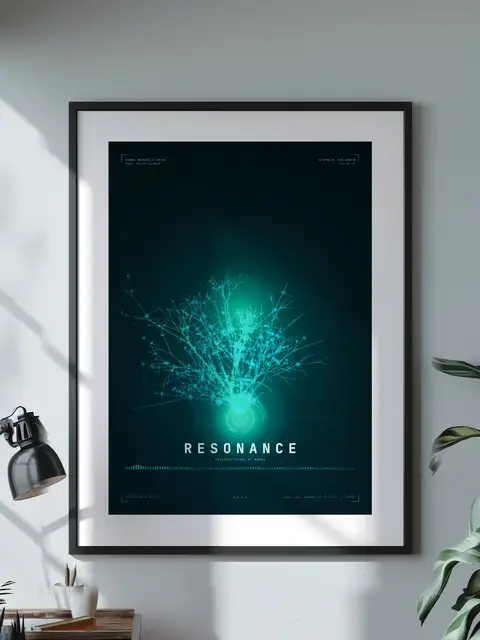
One common method is a grammar: a rule says that one shape is replaced by other shapes, and the replacement is applied again and again. The Signal poster is built this way. A "spoke" either continues straight, splits into two smaller spokes, or ends in a node, and a random draw picks which rule applies at each step.
The three rules fire with probabilities of 73%, 20% and 5%. Applied until the program reaches its limit, they produce 5,396 primitives, of which 5,208 are boxes and 188 are nodes, growing from 15 rays. The guide to fractal flames covers another kind of repeated rule.
spoke → box · spoke(rz + θ, s × 0.8) · spoke(rz − θ, s × 0.8) p = 20%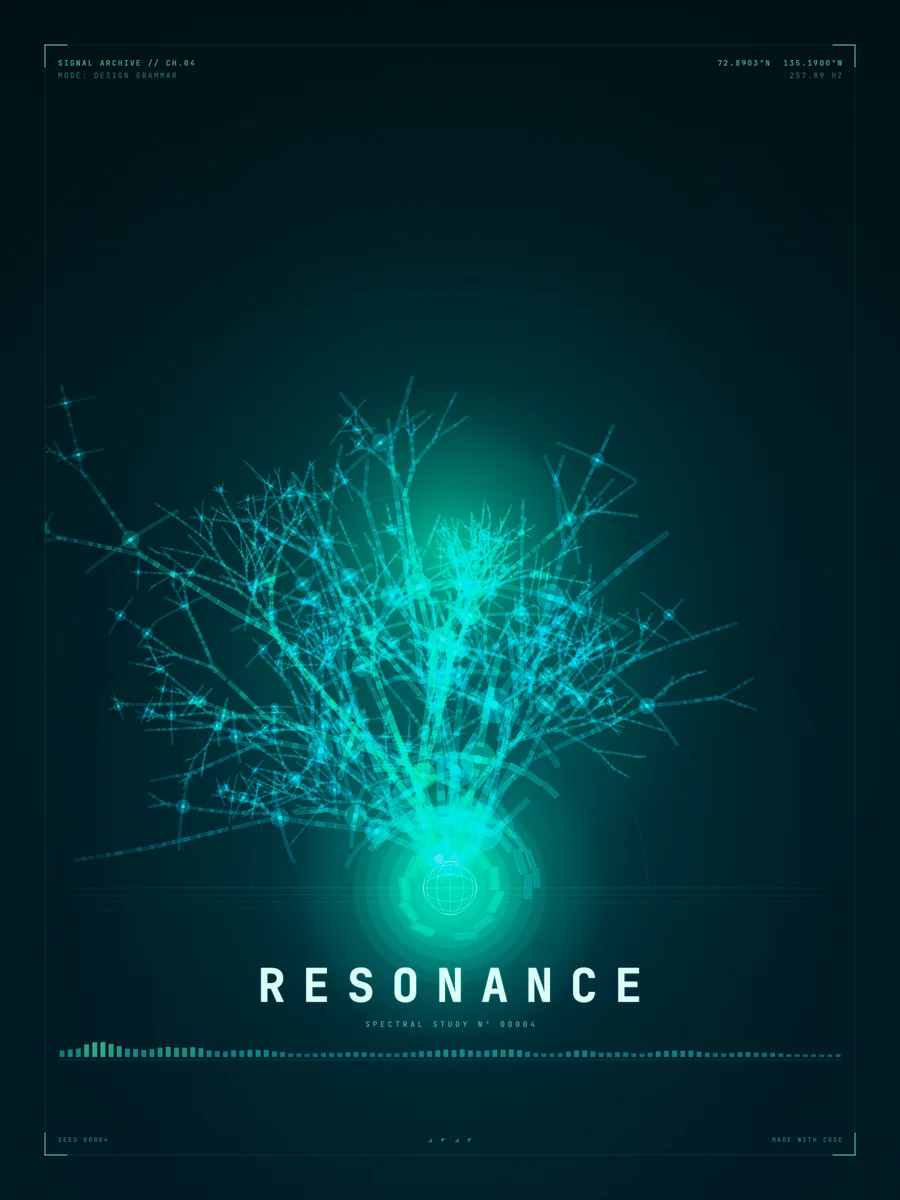
05A signal that steers the drawing
An algorithm needs inputs, and the input does not have to be a picture. Several of our pieces share one control curve s(t) built from a few sine waves, called partials, multiplied by smooth swells. The curve then sets how tall, wide or bright something is at each point along the drawing.
It is the same sum of sines used to describe sound, which is why these pieces look like recordings. The guide to sound wave art explains waveforms and spectrograms. Here the curve is only a source of controlled variation, written as a formula so that it can be repeated exactly.
s(t) = Σₖ aₖ·(½ + ½·sin(2π·fₖ·t + φₖ)) · Σⱼ bⱼ·e^(−((t − cⱼ)/wⱼ)²)06A ribbon from one formula
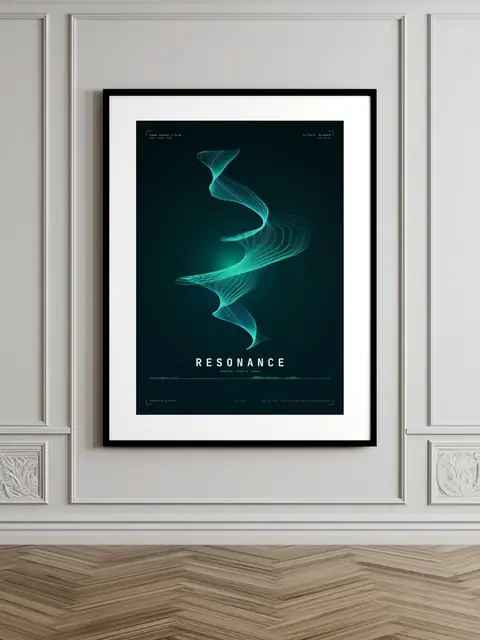
The Aurora poster is one ribbon of 150 lines. Each point P of the ribbon is a centre line C(t) plus an offset that rotates around it by an angle θ(t). That angle grows steadily with t, so the ribbon twists, and a noise term makes the twists uneven.
The width h(t) depends on the control curve, so the ribbon swells where the signal is strong. The piece twists 2.376 times and is built from 105,150 samples. Nothing else is needed: one formula, a set of numbers and a loop over t.
θ(t) = 2π·k·t + θ₀ + 1.4·noise(3t)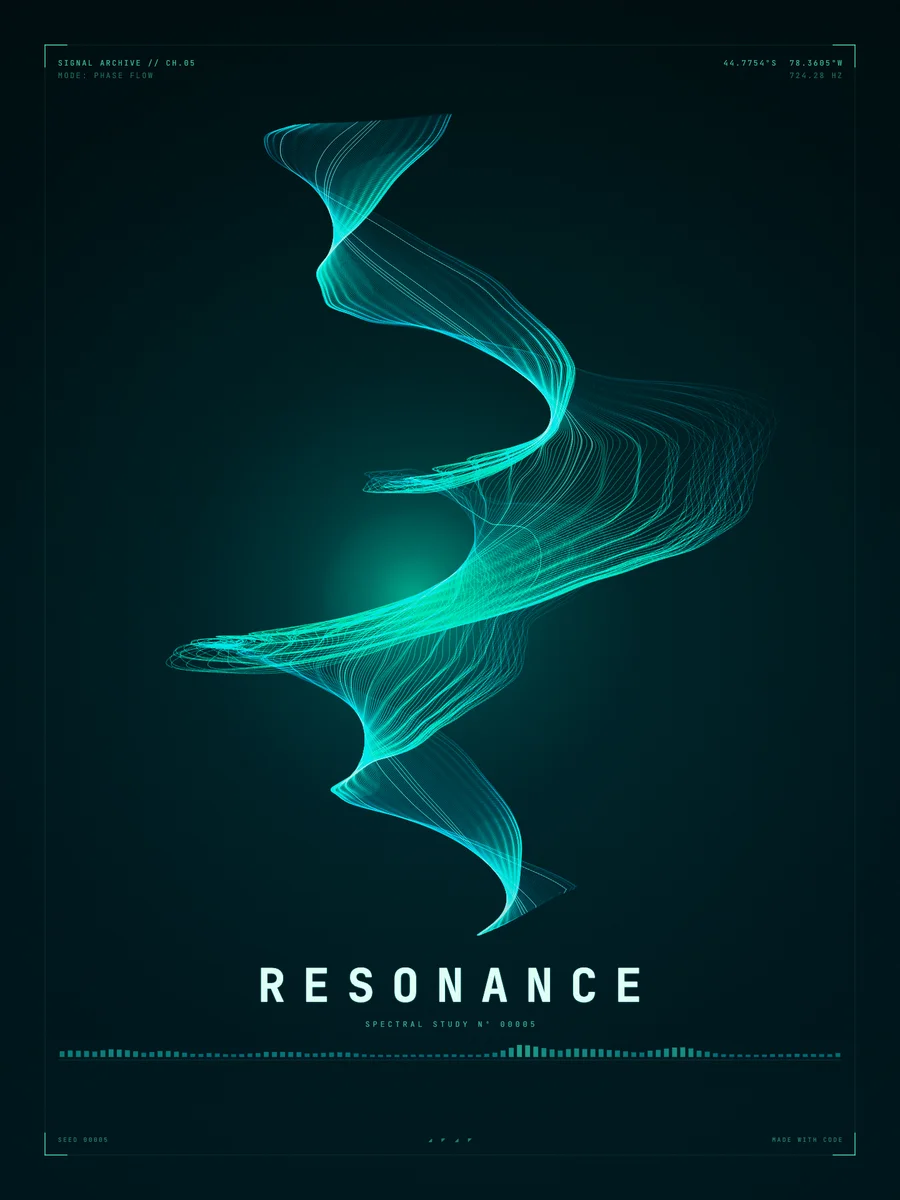
07A city from a grid
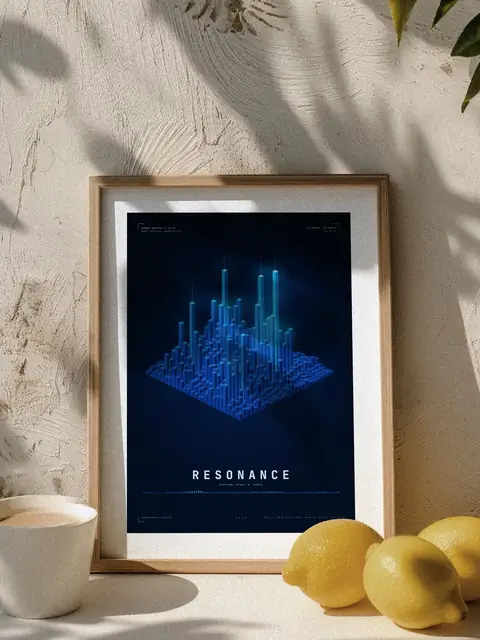
The Metropolis poster uses a grid of 26 by 26 cells, which gives 676 towers. The index i is a frequency band and j is a time slice, so each tower is a spot on a spectrogram. Its height H(i, j) multiplies the control curve at i and at j, adds a little noise, and raises the result to the power 2.1, which makes tall towers rarer than short ones.
This is a typical use of an algorithm in art: a small formula evaluated at every cell of a grid. Change the grid size or the exponent and the skyline changes while the method stays the same.
H(i, j) = (0.75·s(i/G)·s(j/G) + 0.25·n(i, j))^2.1 · c(i, j)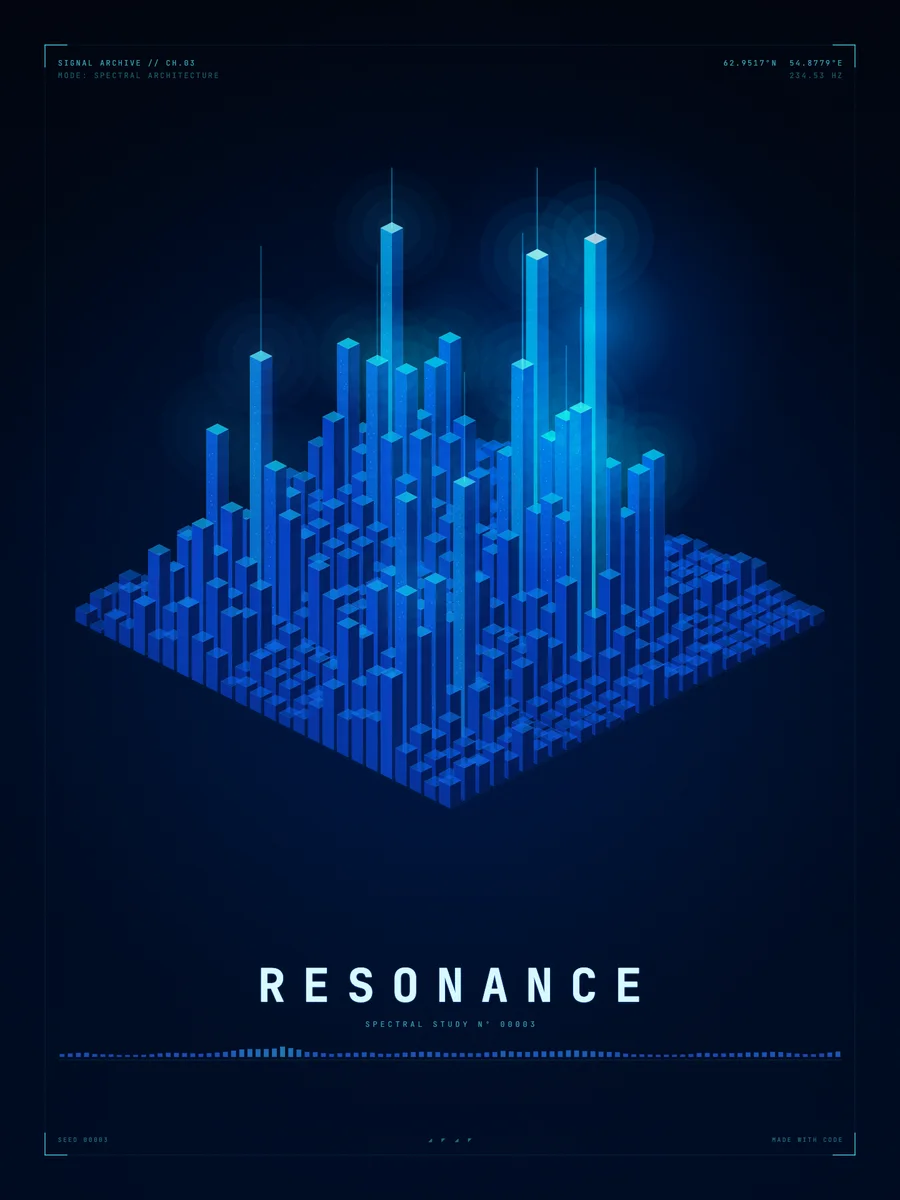
08How our posters relate to algorithmic art
Every Rezonanca poster is made this way: equations or rules written in JavaScript, numbers chosen, and a program that draws the result. We call it Programmer Art. The product page for each piece lists its equations and parameters, so you can see the procedure behind the picture.
Nothing is painted by hand and no photograph is involved. You can run some of the same maps live in /play/. What you see is exactly the print you get, on fine art matte paper.
FAQQuestions
What is algorithmic art?
It is art produced by following a written procedure of exact steps, usually run by a computer. The artist chooses the rules and the numbers, and the program draws the image.
Who were the first algorithmic artists?
Vera Molnar, Frieder Nake, Georg Nees and Manfred Mohr are among the best known early names. Nake and Nees showed plotter drawings in Stuttgart in 1965.
Is algorithmic art the same as computer art?
Not exactly. Computer art is any art made with a computer, while algorithmic art stresses that the image comes from an explicit procedure written by the artist.
Do you need to code to make algorithmic art?
Most of it is made by writing code, but you can start with a short script in JavaScript or Python that draws lines from a formula. The first results appear after a few lines.