Guide // Chaos theory
Lorenz attractor: equations and parameters
The Lorenz attractor is the two-winged shape traced by the solution of three coupled equations with the parameters σ, ρ and β. This page goes through the equations line by line, shows what each parameter controls, and explains how we plot the curve as a poster.
01Where the equations come from
In 1963 the meteorologist Edward Lorenz published a paper titled "Deterministic Nonperiodic Flow". He started from a model of a fluid layer heated from below and cooled from above, the setting known as Rayleigh-Benard convection, and cut it down to the smallest set of equations that still showed the effect he was after.
What remained is three equations for three numbers that change with time t. The variable x measures how fast the fluid circulates, y measures the temperature difference between the rising and the falling fluid, and z measures how far the vertical temperature profile departs from a straight line.
dx/dt = σ(y − x)dy/dt = x(ρ − z) − ydz/dt = xy − βz
02Reading the three lines
The first line pulls x toward y. If y is larger than x, the circulation speeds up, and the factor σ sets how quickly. The second line has the term x(ρ − z): the temperature difference y grows when the circulation x is strong and z is small, and the −y term damps it.
The third line is where the non-linearity sits. The product xy feeds z, and −βz drains it. Products of two variables, such as x(ρ − z) and xy, are what make the system non-linear, and without them the solution would be simple. The general idea of a point moving under such a rule is covered in the guide to strange attractors.
03What σ, ρ and β do
Each parameter has a physical meaning. σ is the Prandtl number, the ratio of how easily the fluid flows to how easily it conducts heat. ρ is the Rayleigh number measured against its critical value, and it describes how hard the layer is heated. β is a geometric factor tied to the shape of the convection cells.
The classic values, chosen by Lorenz, are σ = 10, ρ = 28 and β = 8/3. Of the three, ρ is the one that changes the behaviour most. Raise it from zero and the motion goes through very different regimes, as the next sections show.
σ = 10, ρ = 28, β = 8/304Fixed points and the road to chaos
A fixed point is a place where all three derivatives are zero, so a point put there stays there. For ρ below 1 the only fixed point is the origin, and every path falls into it: the fluid stops moving. At ρ = 1 two more fixed points appear, one for each direction of circulation.
For the classic σ and β, those two points sit at x = y = ±√(β(ρ − 1)) and z = ρ − 1. At ρ = 28 that is x = y = ±8.485 and z = 27. They are stable only up to ρ of about 24.74. Above that value the paths spiral away from both of them and never settle, and chaos begins.
x = y = ±√(β(ρ − 1)), z = ρ − 105Why there are two wings
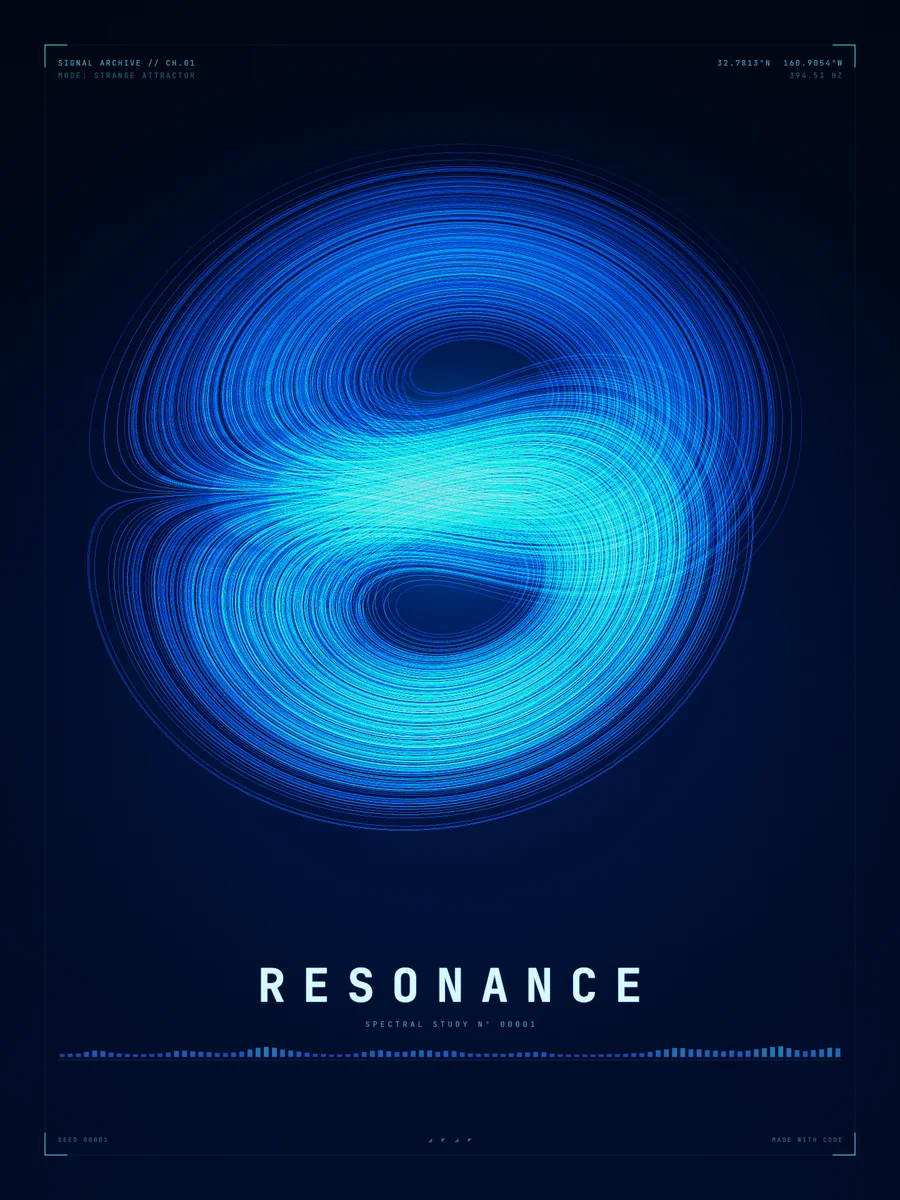
At ρ = 28 the two fixed points are still there, but both repel the path. The point spirals outward around one of them, and when the spiral grows large enough the path crosses over to the other and starts spiralling around that one. Those two spirals are the two wings.
How many loops the path makes on one wing before it switches is the part that cannot be predicted. The sequence of loop counts looks random, even though the equations contain no randomness at all. This is the property that gave rise to the butterfly effect.
06Volume shrinks, yet the path never repeats
Take a small blob of starting points and follow all of them. The Lorenz system squeezes the blob: its volume shrinks at the constant rate σ + 1 + β, which for the classic values is about 13.67. After a short time the blob has collapsed onto a surface of zero volume, which is the attractor.
A path on that surface still cannot repeat or cross itself, so it folds into ever thinner layers. The attractor therefore has a fractal dimension, a little above 2 and well below 3. Shrinking volume and a never-repeating path are the two properties that together define a strange attractor.
∇·F = −(σ + 1 + β) ≈ −13.6707Sensitivity and the Lyapunov exponent
Two paths that start very close together follow each other for a while, then separate. The average rate of separation is the largest Lyapunov exponent λ. A positive value means chaos. Our program estimates it while it draws, and for the Lorenz piece it reports λ = 0.907.
The same idea, with a pendulum instead of convection, is worked out in the guide to double pendulum chaos. There the starting angles play the role that the starting point plays here.
|δ(t)| ≈ |δ₀|·e^(λt)08How the curve is plotted
There is no formula that gives x, y and z at any time t, so the program solves the equations in small steps with the fourth-order Runge-Kutta method (RK4). For our piece the time step is dt = 0.004 and the path is followed for 260,000 steps, starting from x = −6.353, y = −4.015, z = 27.645.
The three-dimensional path is then projected onto the page from a chosen viewing angle. Brightness records how often the path passes through each spot, so the busy regions glow and the rare ones stay dark. For a different flow drawn the same way, see the Halvorsen attractor.
09Our Lorenz poster
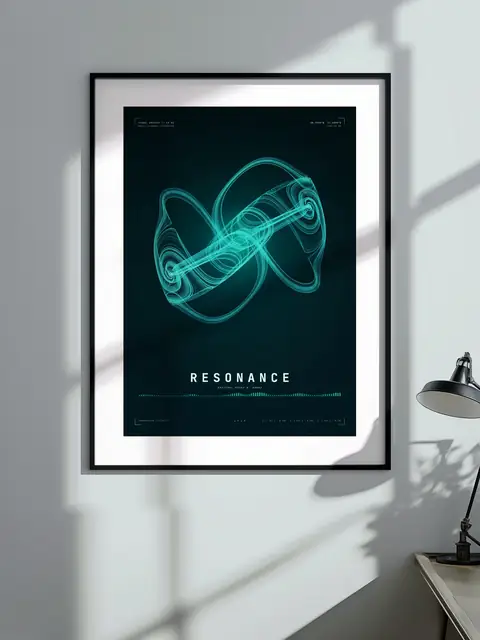
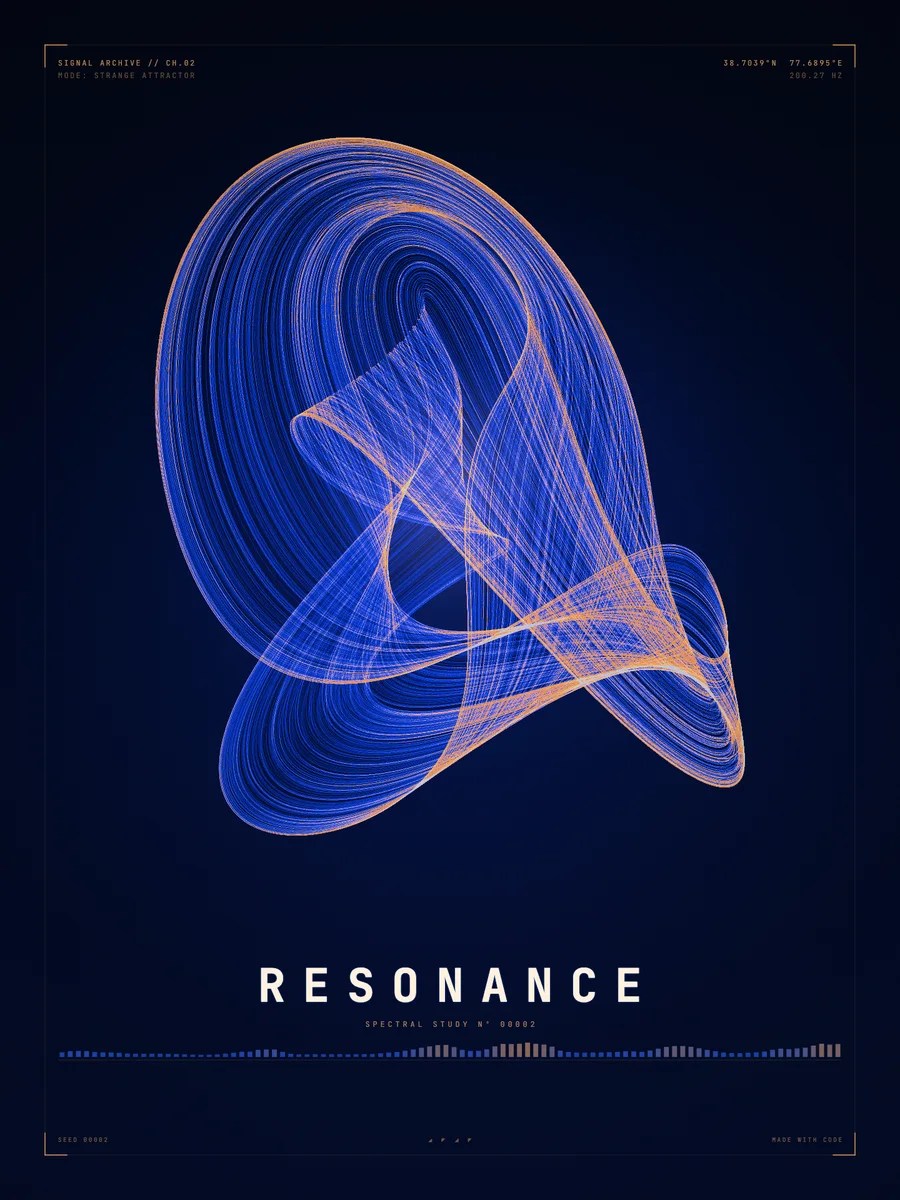
The Lorenz poster is drawn by a program written in JavaScript from the equations on this page. The product page lists the equations, the parameters, the starting point and the measured values, so the numbers quoted here are the ones behind the picture. You can also try attractor maps live in /play/.
Nothing is painted by hand and no photograph is involved. What you see is exactly the print you get, on fine art matte paper.
FAQQuestions
What are the Lorenz attractor equations?
They are dx/dt = σ(y − x), dy/dt = x(ρ − z) − y and dz/dt = xy − βz. The classic parameters are σ = 10, ρ = 28 and β = 8/3.
What does ρ do in the Lorenz system?
ρ is the Rayleigh number, a measure of how strongly the fluid layer is heated. Below 1 the motion dies out, and for the classic σ and β chaos appears above about 24.74.
Why is the Lorenz attractor shaped like a butterfly?
The path spirals around two unstable fixed points and jumps between them at unpredictable moments. Each spiral forms one wing.
How do you plot the Lorenz attractor?
Solve the three equations in small time steps, for example with the Runge-Kutta method, store every point, and project the 3D path onto a plane.