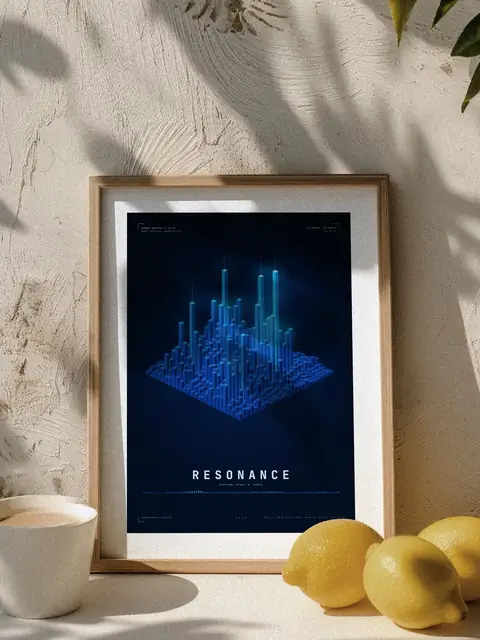
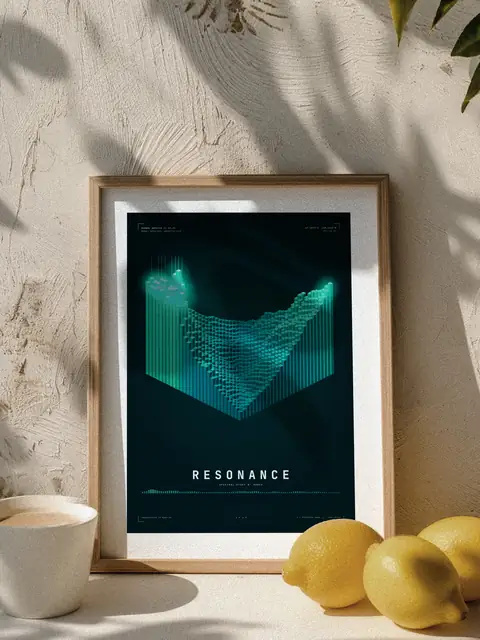
The story
The same spectrogram wound into a circle: time runs around the plaza, frequency from the centre outwards, 716 towers. A wheel-shaped space station was described in 1928 by Slovenian engineer Herman Potočnik.
200 gsm enhanced matte
Printed on thick uncoated art paper at 300 DPI. Rich colour, razor-sharp lines, no glare.
Black or natural wood
Wooden frame, 22 mm deep, with plexiglass that is lighter and safer than glass. Arrives ready to hang.
Free shipping worldwide
Each print is made for you when you order and packed to arrive flawless, wherever you are.
The story
The same spectrogram wound into a circle: time runs around the plaza, frequency from the centre outwards, 716 towers. A wheel-shaped space station was described in 1928 by Slovenian engineer Herman Potočnik.
MATHEMATICS
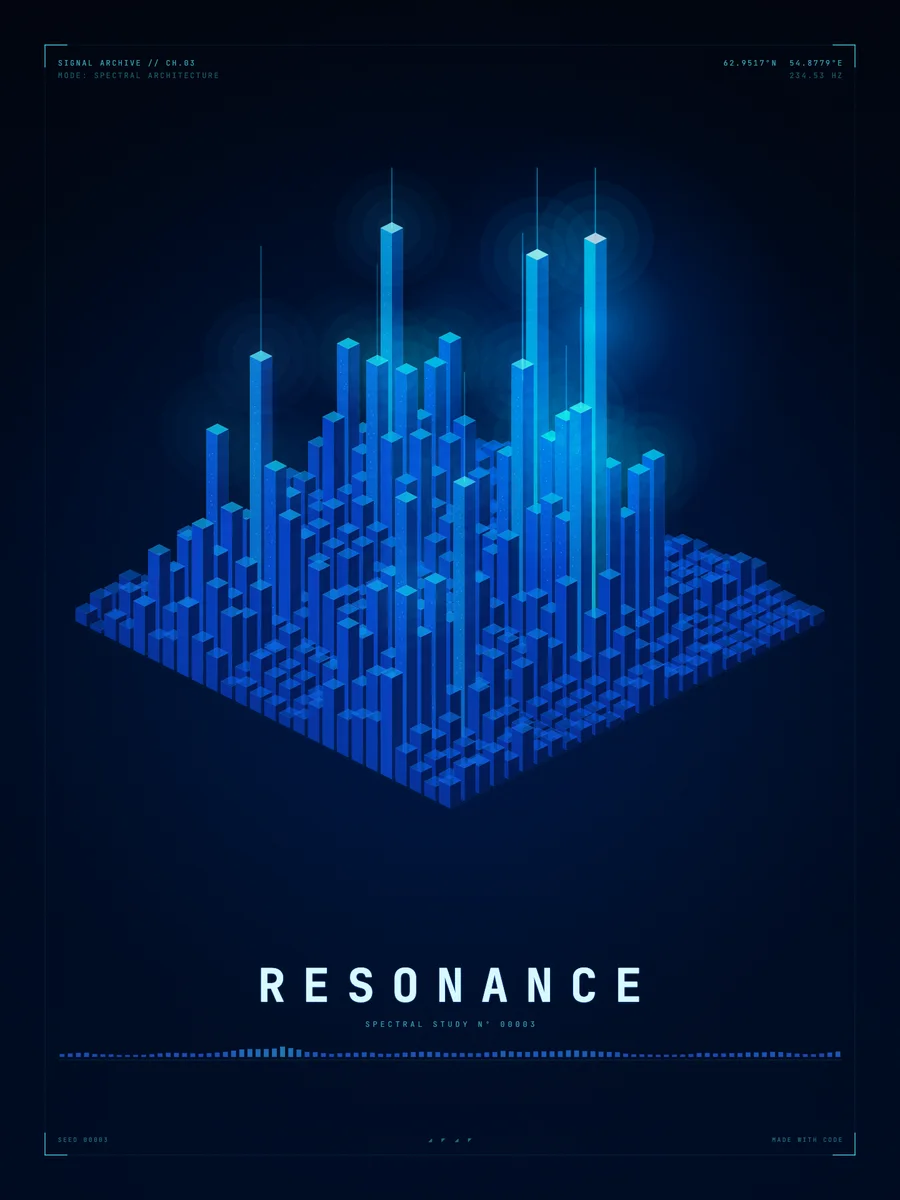
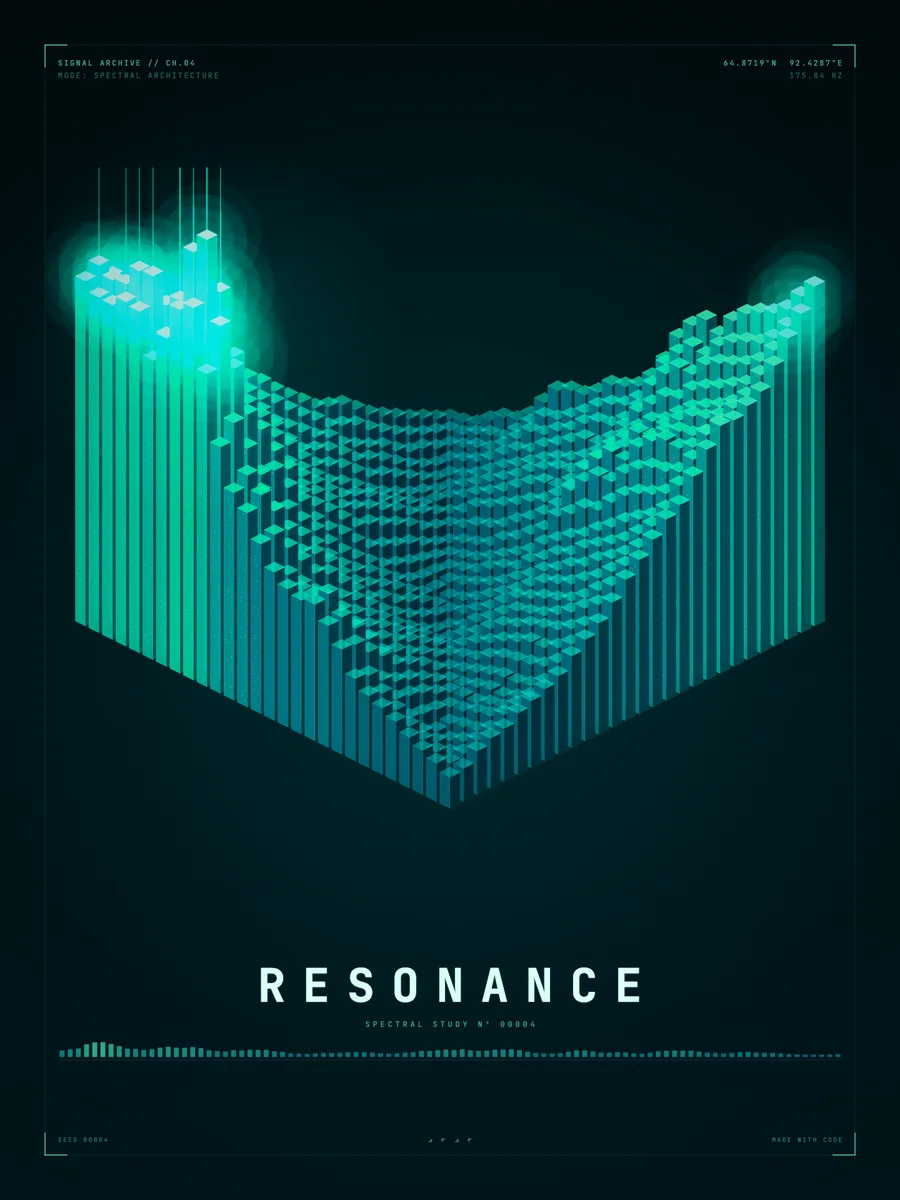
Every piece is computed, not drawn. These are the real equations and numbers from the program that made this exact piece.
Read the guide: Perlin noise explained →H(r, α) = s(α)^1.5 · e^(−((r − 0.62)/0.16)²) + 0.12·ni = frequency band, j = time slices(t) = Σₖ aₖ·(½ + ½·sin(2π·fₖ·t + φₖ)) · Σⱼ bⱼ·e^(−((t − cⱼ)/wⱼ)²)
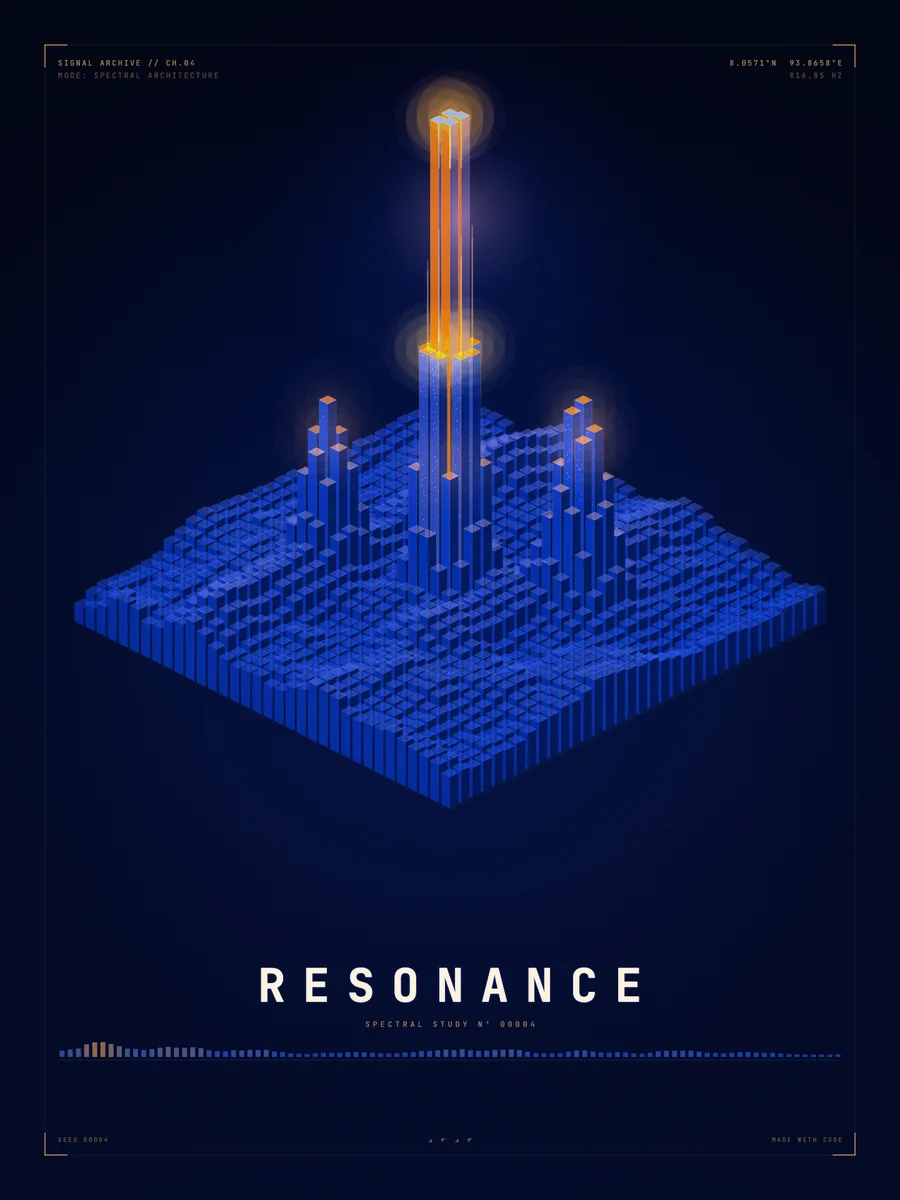
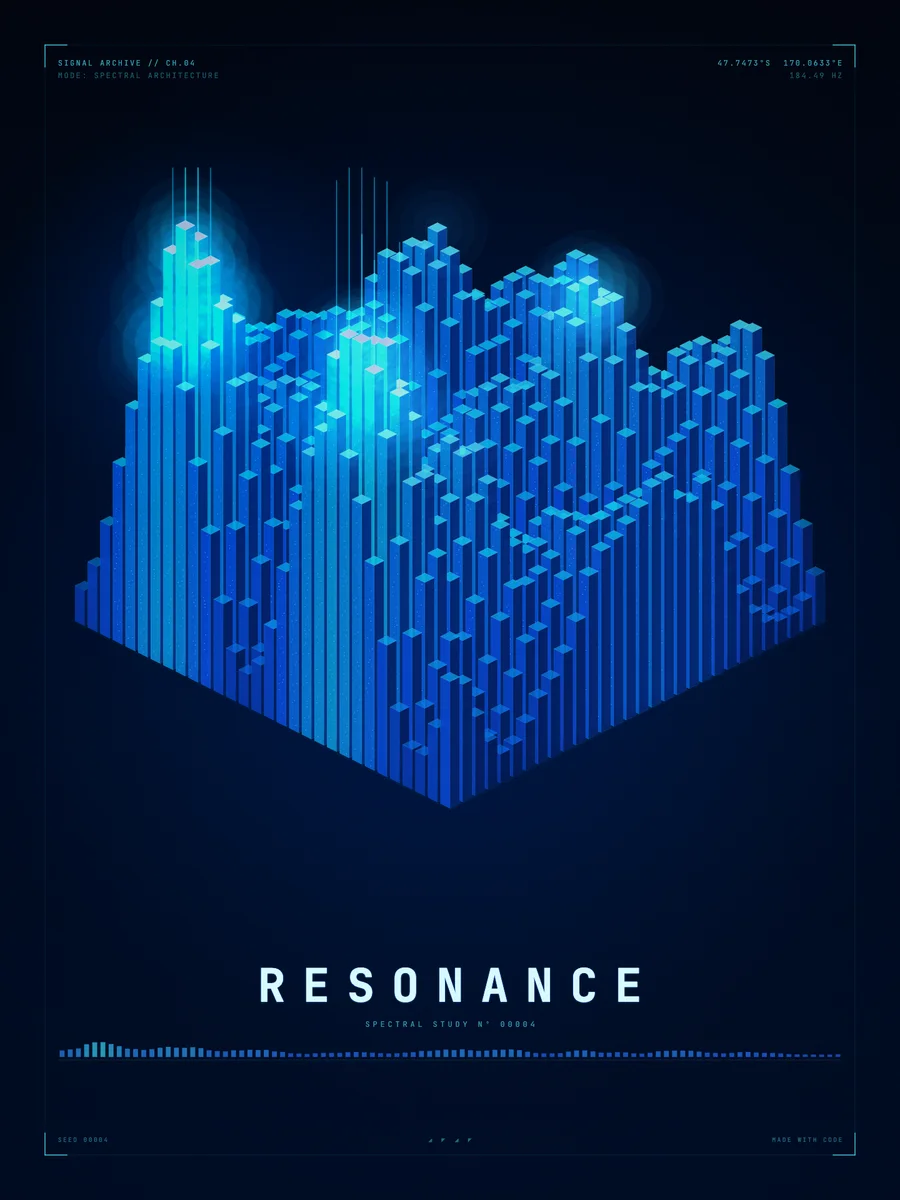
The form is driven by a sound signal made of the frequencies 5.802 · 15.055 · 3.086 · 14.985. Where the signal is louder, the structure grows further.
Nature is neither perfectly smooth nor completely random: clouds, mountains and waves are somewhere in between. In 1983 Ken Perlin invented a noise that looks like nature: a smooth function that gives random but gentle changes. The program adds four layers (octaves) of this noise, each half as strong and twice as fine as the last. That is what gives the lines life, so they don't look like they were drawn with a ruler.
HISTORY
Joseph Fourier publishes that any periodic signal can be broken into a sum of sine waves. It is the basis of sound analysis.
Bell Labs presents "visible speech": a spectrograph that turns sound into a picture of frequencies over time.
Cooley and Tukey publish the Fast Fourier Transform (FFT), putting spectrograms within reach of every computer.
Ken Perlin works on the effects for the film Tron and is frustrated that computer images look too "machine-like".
Perlin invents his noise and publishes it in 1985 at SIGGRAPH, in the paper "An Image Synthesizer".
Perlin receives an Academy Award for Technical Achievement: his noise becomes the basis of smoke, fire and cloud textures in film.
Perlin publishes an improved version and "simplex" noise. Today games, films and programmer art all over the world use it.
A spectrogram is a picture of sound: time runs left to right, frequency bottom to top. Ornithologists have used it to read birdsong since the 1950s.
Follow along
Explore other series