MATHEMATICS
The maths behind the picture
Every piece is computed, not drawn. These are the real equations and numbers from the program that made this exact piece.
zₙ₊₁ = zₙ² + cz₀ = 0|zₙ| > 2 ⇒ c ∉ M- Re(c) centre
- -0.374043
- Im(c) centre
- 0.659793
- Window width
- 0.0025
- Magnification ×
- 1,240
- Max iterations
- 1,500
- Rotation
- -15.1°
- Points computed
- 1,533,070
- Inside the set (%)
- 0
- Mean escape
- 90.8
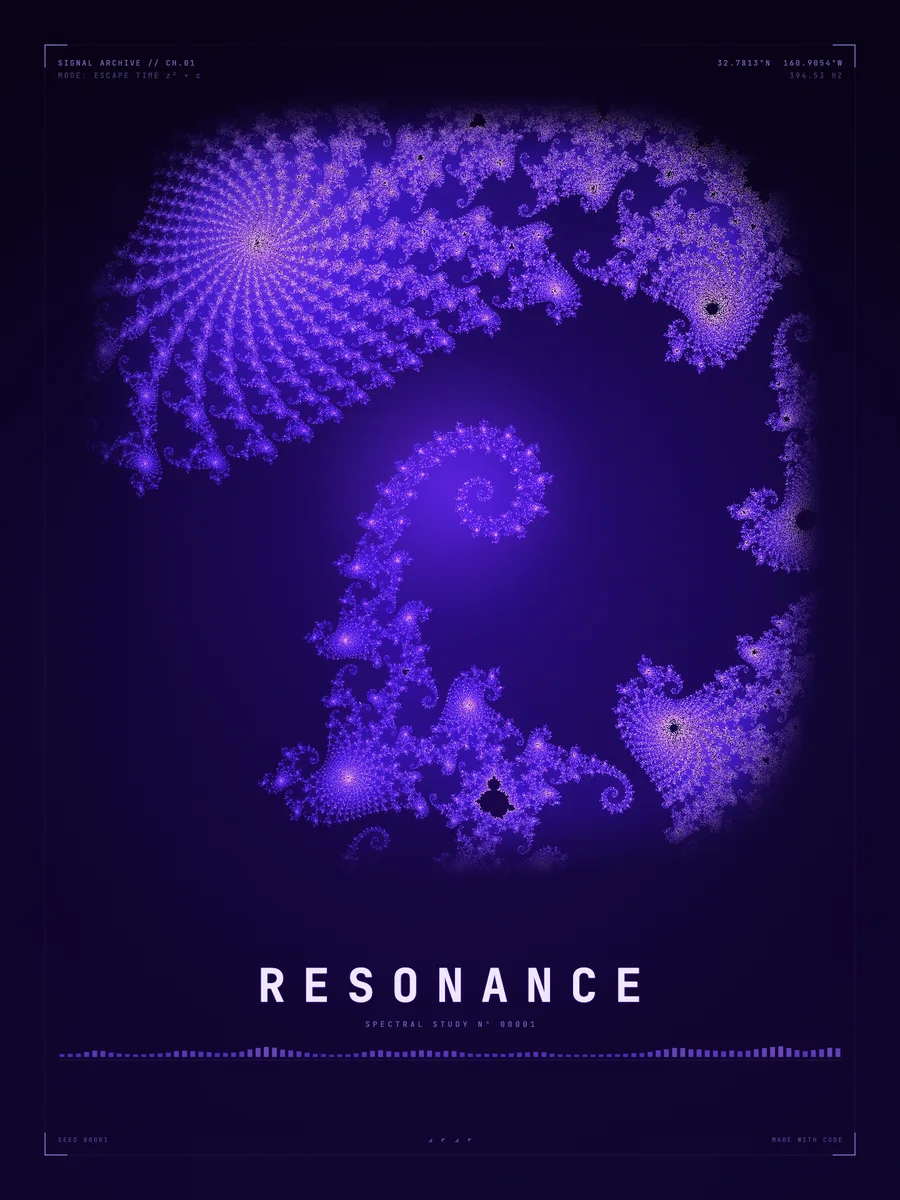
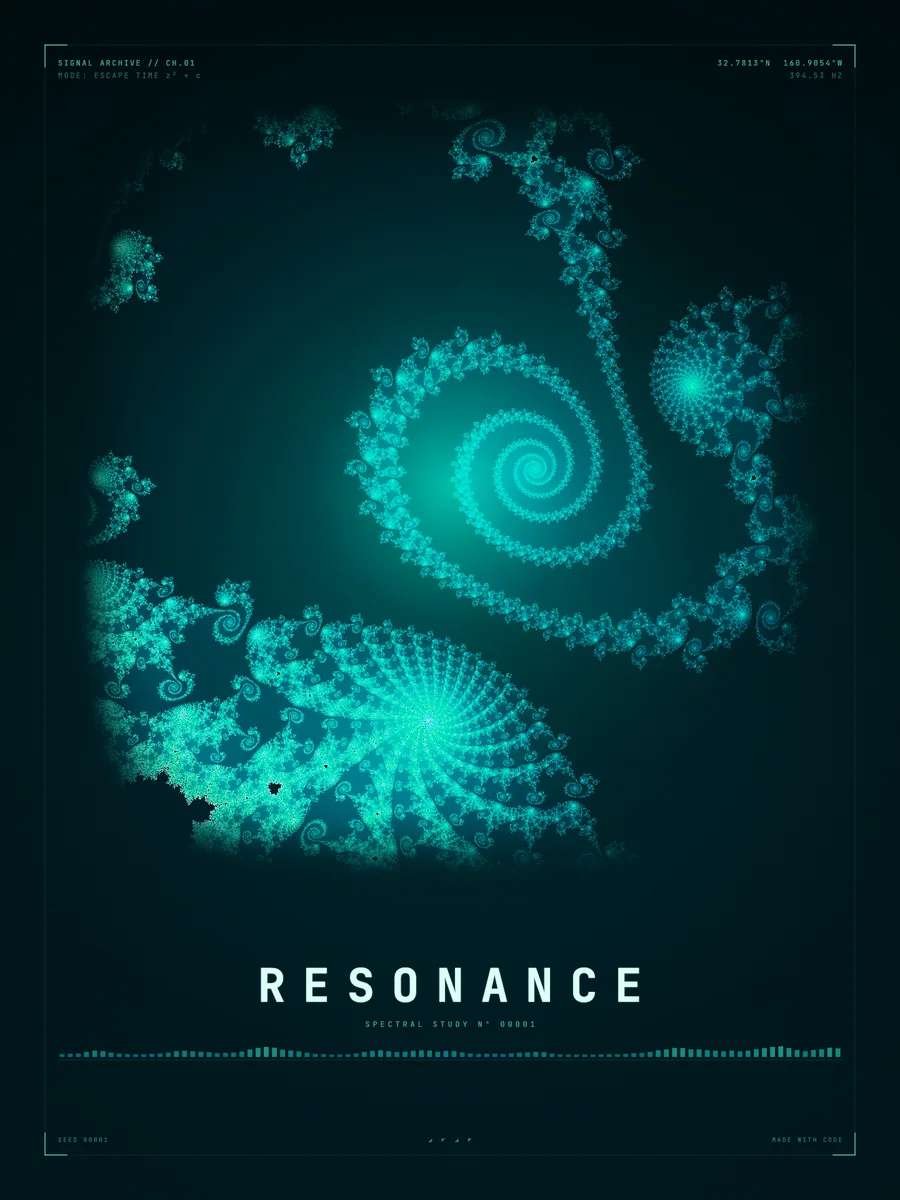
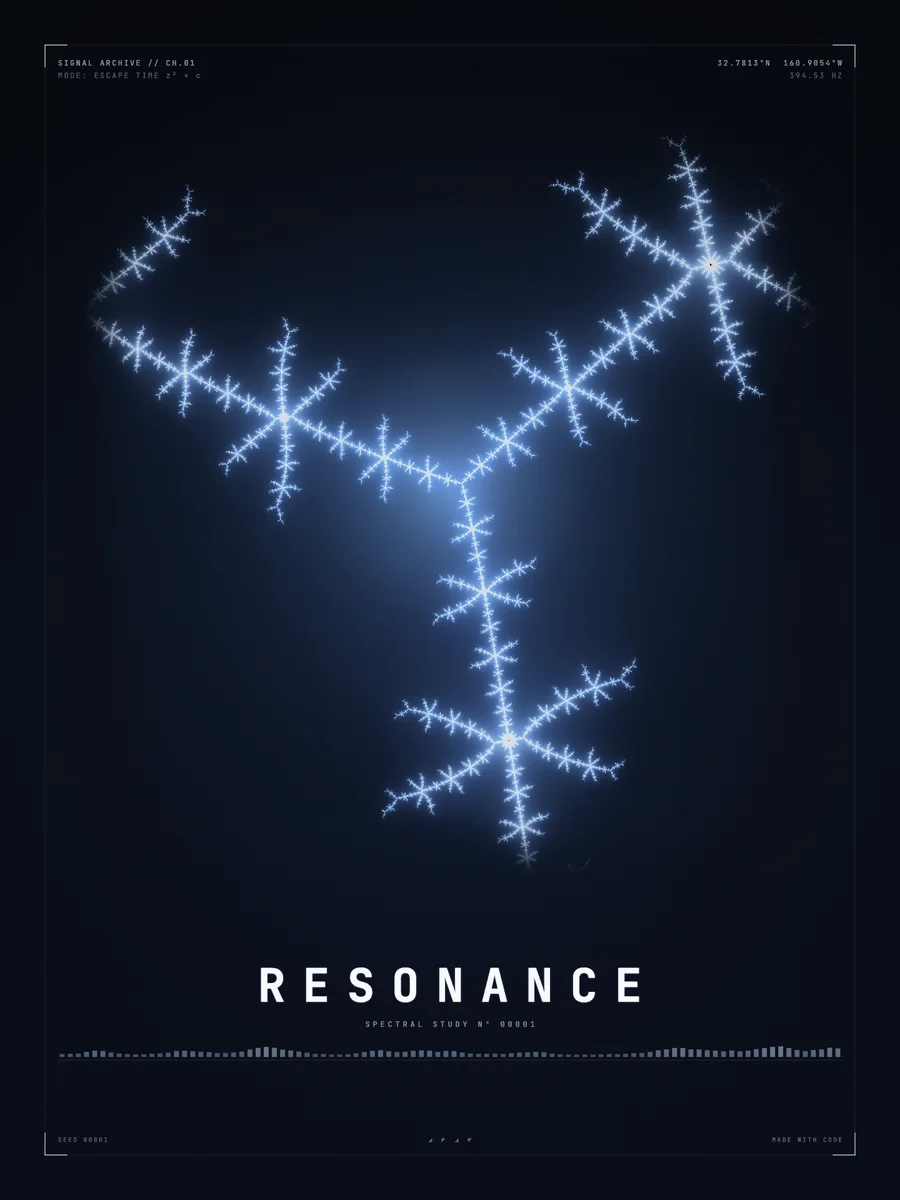
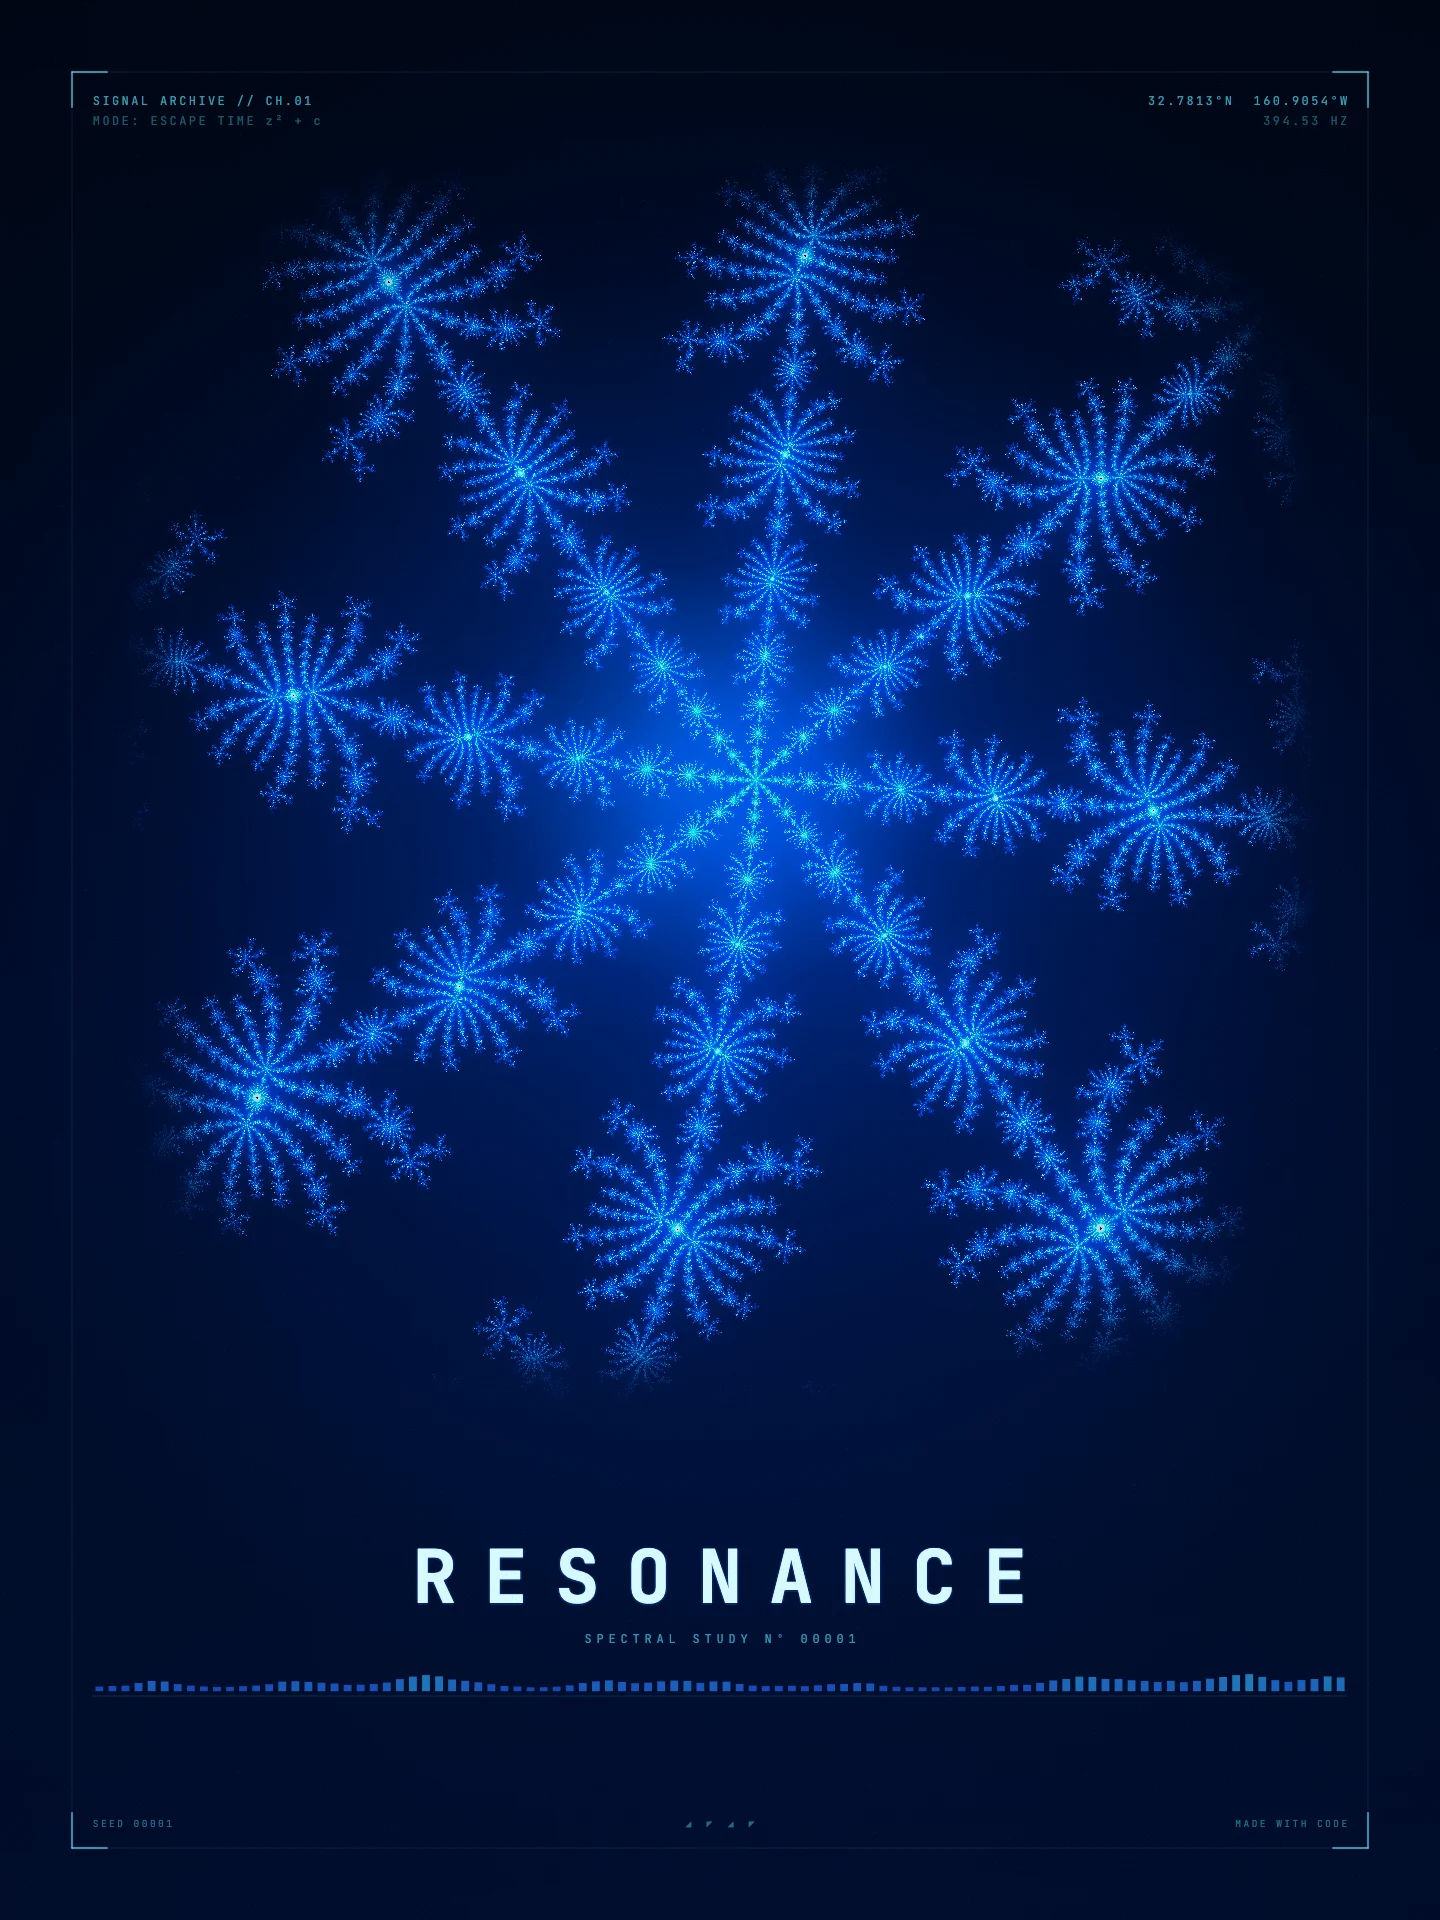
This window is magnified 1,240 times, at a place where the set has no interior: everything you see is the thin filaments of the boundary itself. Points around them escape after 91 steps on average, and each point's colour is exactly that count.
HISTORY
Where this idea comes from
Mandelbrot
- 1918
Gaston Julia and Pierre Fatou study the iteration of complex functions, with no computers, only pencil and paper.
- 1978
Robert Brooks and Peter Matelski publish the first picture of the set, printed in characters on a line printer.
- 1980
Benoit Mandelbrot at IBM explores the set by computer and reveals its infinite complexity. He had coined the word "fractal" in 1975.
- 1982
Adrien Douady and John Hubbard prove the set is connected and name it after Mandelbrot.